If you trade on NinjaTrader 8, two tools will transform how you read the market: the volume profile indicator and the TPO Market Profile. Both create a profile of market activity along the price axis. Both reveal value areas, points of control, and auction-driven levels. Yet they measure fundamentally different things — and knowing when to reach for each one is the difference between a cluttered chart and a decisive trading plan.
This guide breaks down NinjaTrader volume profile versus NinjaTrader market profile in plain language. You will learn what each tool measures, the patterns that matter, when to favor one over the other, and how to combine them into a single workflow using session volume profile and session TPO charts. By the end, you will know exactly which profiles to load for any trading scenario — from scalping ES to swing-trading NQ over multiple sessions.
If you are new to order flow in general, start with our best NinjaTrader order flow indicators overview or our deep-dive footprint chart guide first. Otherwise, let’s dive in.
Volume Profile Explained — Seeing Where Volume Lives
What Is Volume Profile?
Volume Profile plots the total volume traded at each price level over a chosen time period. Most traders are familiar with the volume bars at the bottom of a candlestick chart — those bars show you how much volume occurred during each candle, answering the question when did volume happen. Volume Profile flips the axis. Instead of plotting volume against time on the X-axis, it plots volume against price on the Y-axis. The result is a horizontal histogram that answers a far more useful question: where did volume happen?
This distinction matters because price levels where heavy volume traded reveal where large participants built positions. Those levels become anchors for future price action. They attract price, slow it down, and force traders to make decisions. Price levels where almost no volume traded tell you the opposite — the market rejected those prices and moved through them quickly.
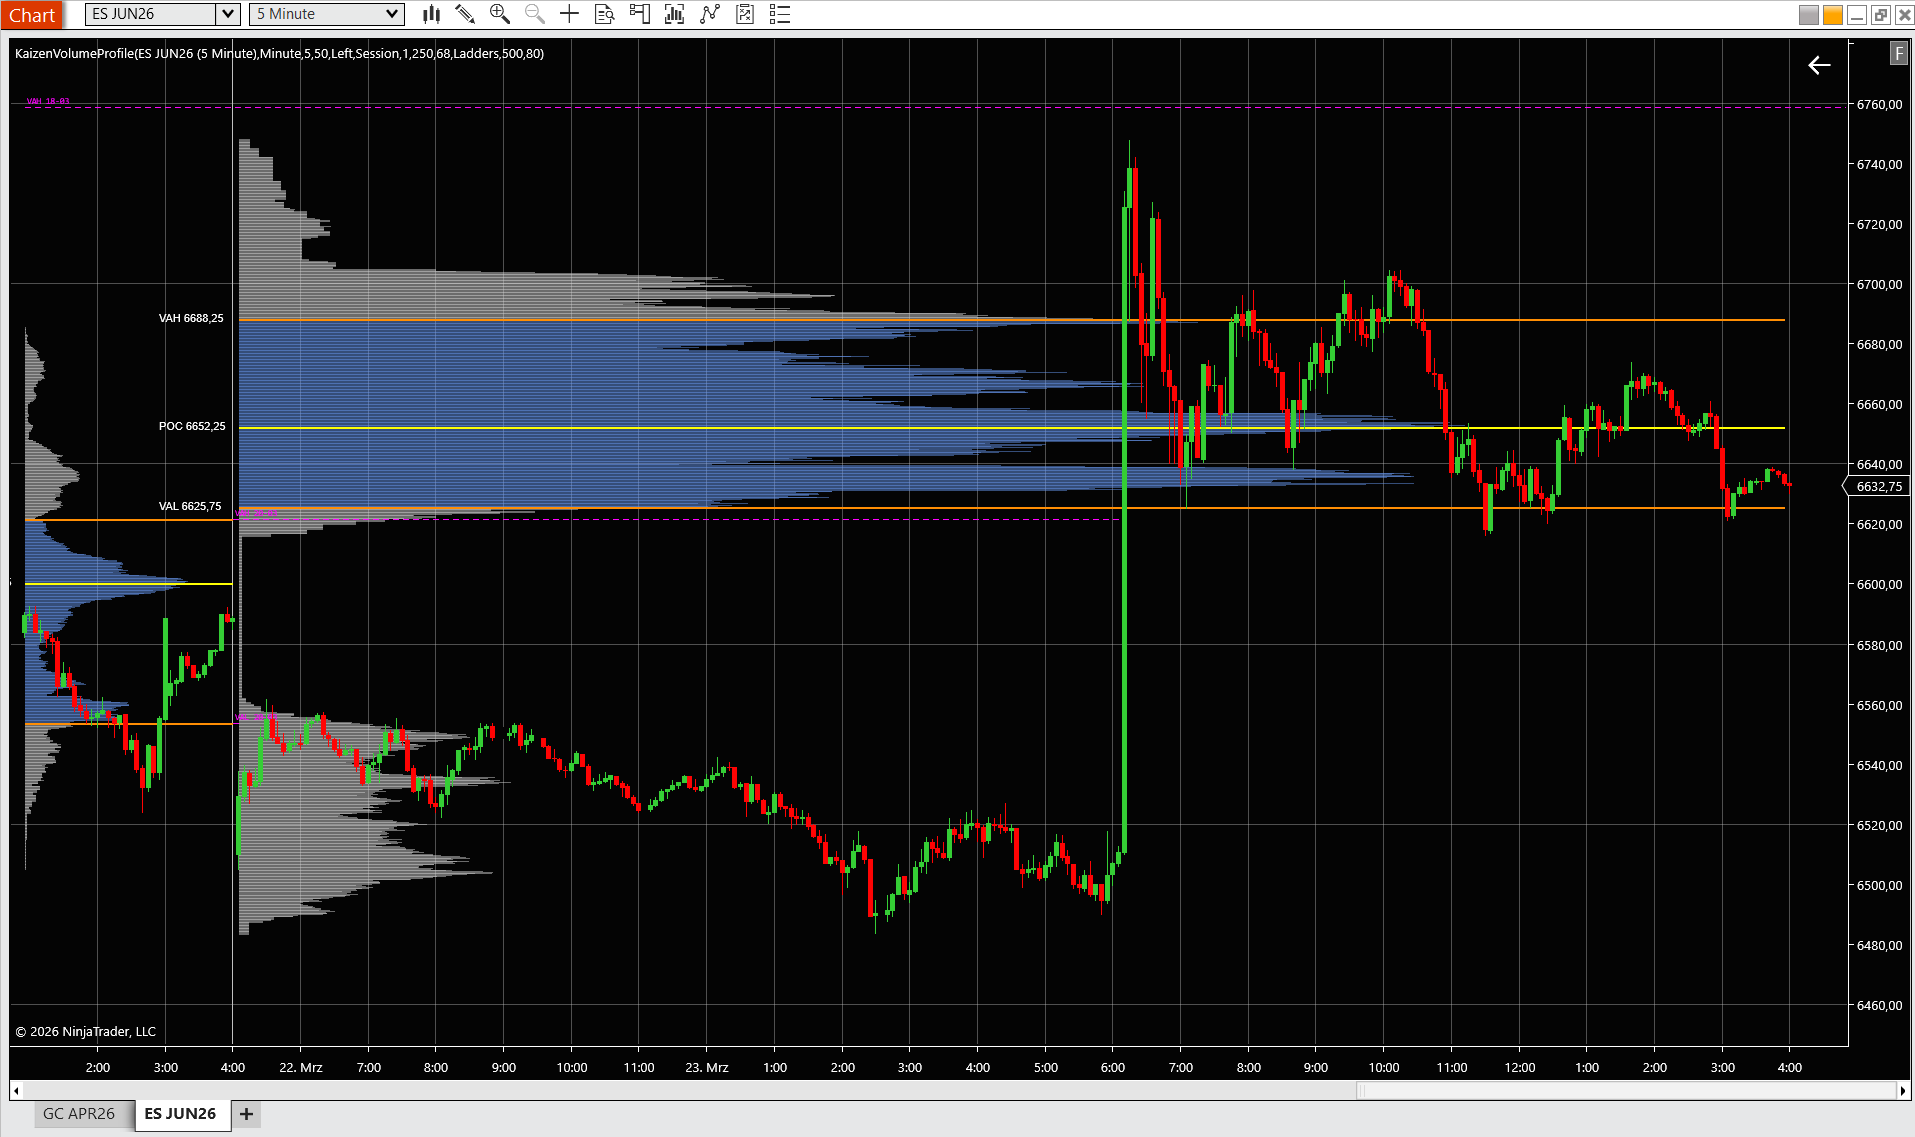
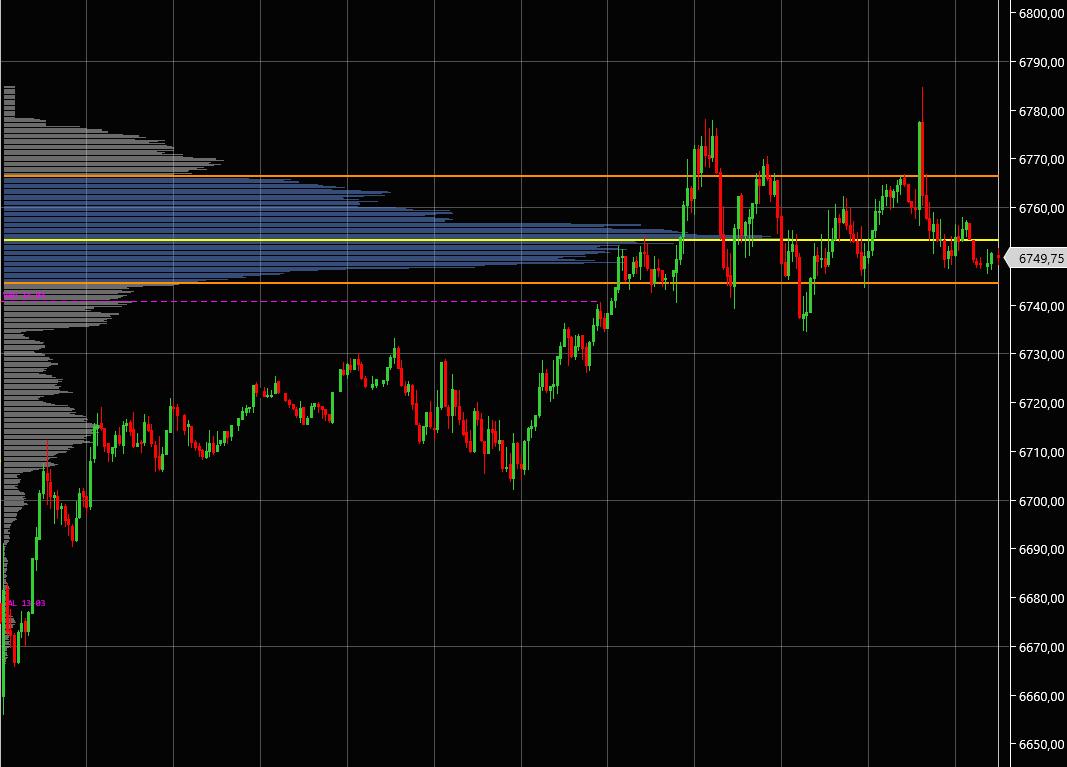
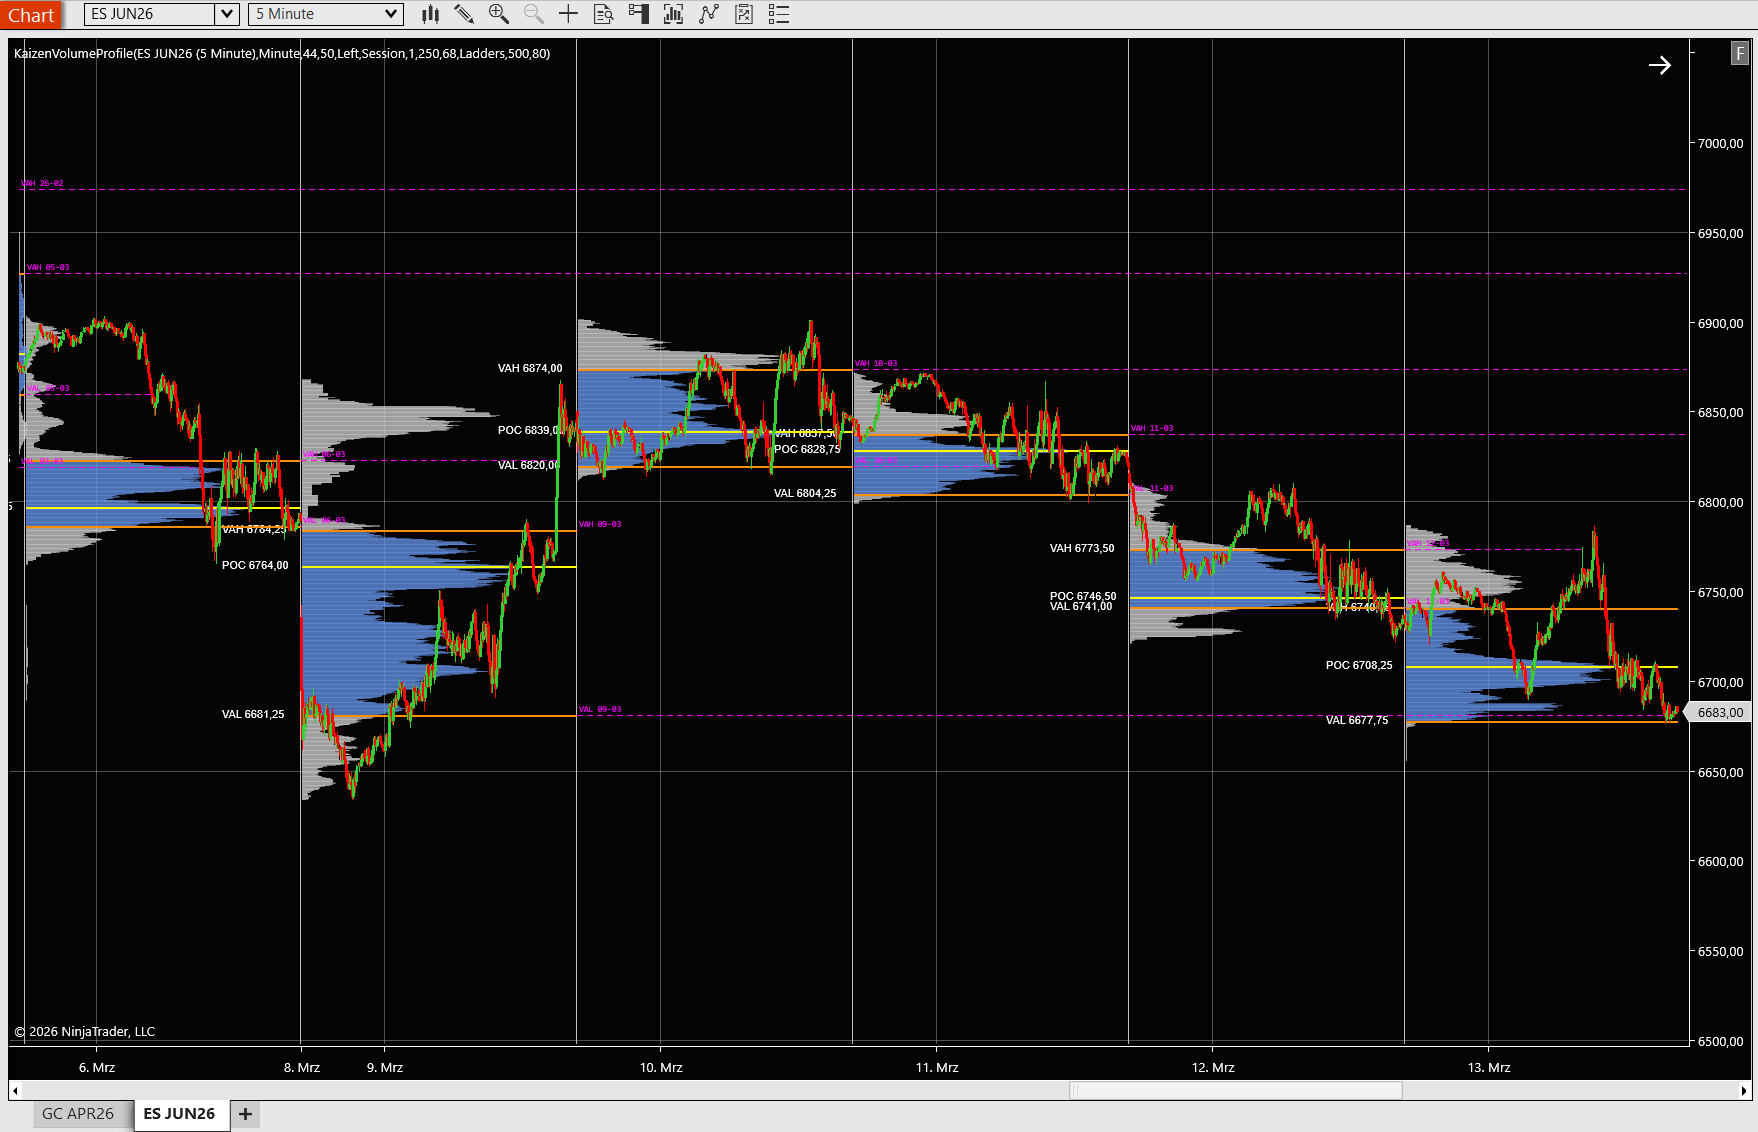
On NinjaTrader 8, you can load a volume profile indicator directly onto any chart. Kaizen Volume Profile renders the histogram in real time as each tick updates the profile, giving you a living picture of where the money is flowing during the current session.
How Volume Profile Works
When you add a volume profile to your chart, you will see a histogram anchored to the Y-axis (price). Each horizontal bar represents a single price level (or a small price bucket, depending on your tick size and aggregation setting). The wider the bar, the more contracts were traded at that price.
Three components define every volume profile:
-
POC (Point of Control) — The price level with the highest traded volume. This is the single most important level on the profile. It represents the price where the most business was done, where the most buyers and sellers agreed on value. On a session profile, the developing POC often acts as a magnet that pulls price back toward it.
-
VAH (Value Area High) and VAL (Value Area Low) — The boundaries of the Value Area, which is the range of prices where approximately 68–70% of the total volume occurred. Think of the Value Area as the “fair value zone” for the session. Prices inside value are accepted; prices outside value are being explored.
-
HVN (High Volume Node) and LVN (Low Volume Node) — Beyond the POC and Value Area, experienced traders identify specific clusters. An HVN is a local peak on the histogram — a price with notably more volume than the prices immediately above and below it. HVNs act as magnets for price and as strong support or resistance because many participants have positions at those levels and will defend them. An LVN is the opposite — a trough on the histogram where little volume traded. LVNs are “air pockets.” Price tends to travel through them quickly because there is no accumulation to slow it down.
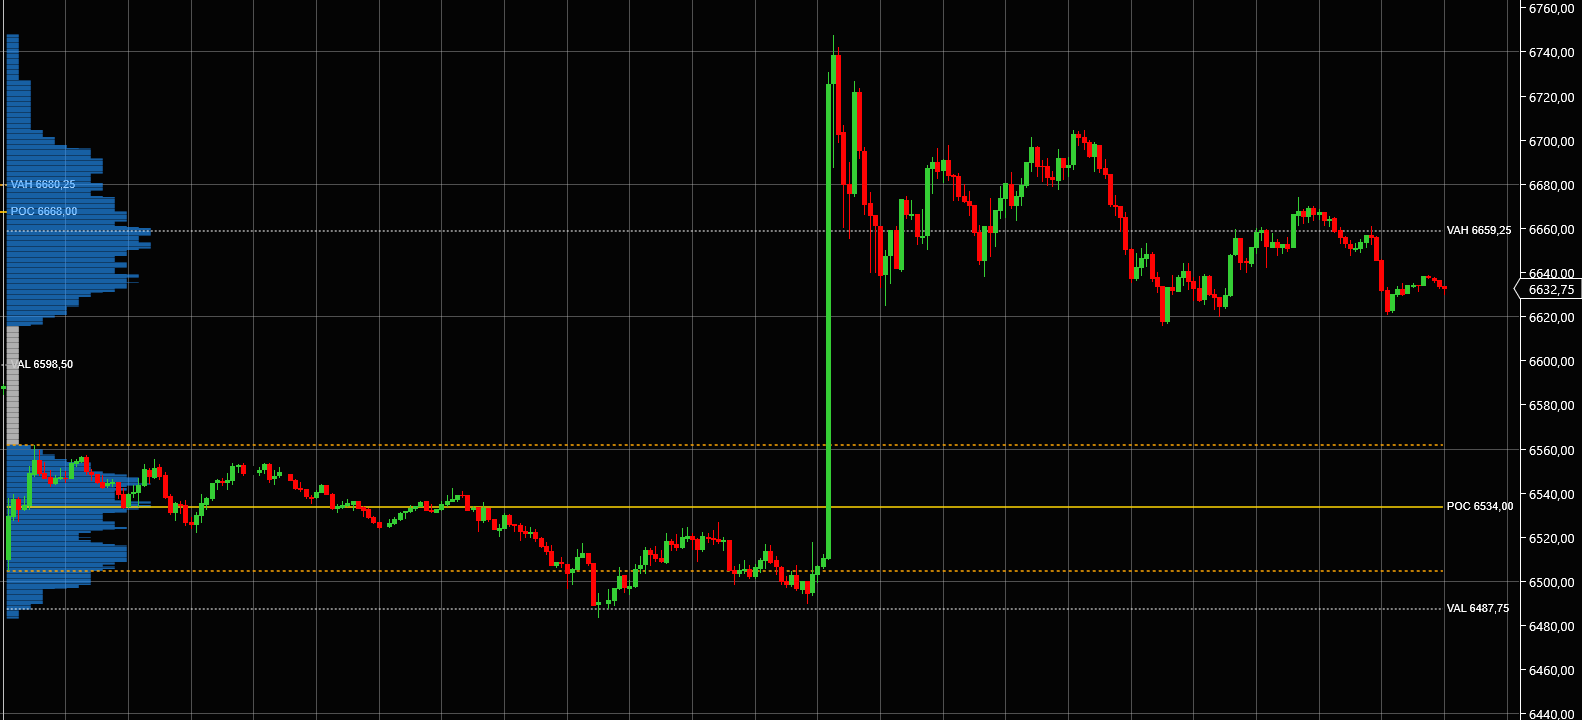
On a practical level, a session volume profile on an ES 5-minute chart might show a POC at 6652.25 with 8,900 contracts, a VAH at 6688.25 and a VAL at 6625.75. Between 6559.50 and 6616.25, you see an LVN — a thin area on the histogram where fewer than 100 contracts changed hands. That LVN is a potential breakout zone. If price pushes underneath the VAL and through that thin area, it has room to run. If it stalls and the LVN starts filling in with volume, the breakout is failing.
Key Volume Profile Patterns
The overall shape of a volume profile tells you a story about what happened during the session or period it covers. Three shapes appear repeatedly:
P-shape profile — Volume is concentrated in the upper portion of the range, with a thin tail extending downward. This shape often forms during long liquidation or short covering rallies. Price traded down to lower levels early in the session, but buyers (or short-covering) pushed price back up and kept it there. The value area built at the highs. A P-shape on a daily profile tells you that the market rejected lower prices and that buyers were in control by the close. Watch the bottom of the thin tail — if price returns there the next session, it is testing a level that was already rejected once.
b-shape profile — The mirror image. Volume is concentrated in the lower portion of the range, with a thin tail extending upward. This forms during buying exhaustion or aggressive selling. Price explored higher levels but could not sustain them. The value area built at the lows. A b-shape warns you that sellers are in control and that the highs of that session are vulnerable. If price approaches those highs again, you have a natural area to look for shorts.
D-shape profile — A balanced, bell-curve distribution where volume is heaviest in the middle and tapers symmetrically toward the highs and lows. This is the “normal” profile. It tells you the market found equilibrium. The POC sits near the center of the range, and the Value Area covers most of the range. D-shapes are common on range-bound, rotational days. They signal that neither buyers nor sellers dominated, and mean-reversion strategies (fading moves to the edges of value) tend to work well.
Understanding these shapes gives you a fast read on the balance of power. Before you even look at a single candlestick pattern, a glance at the session’s volume profile shape tells you whether buyers dominated, sellers dominated, or the market was in balance.
TPO Market Profile Explained — Seeing Where Time Was Spent
What Is TPO?
TPO (Time Price Opportunity) Market Profile was developed by J. Peter Steidlmayer at the Chicago Board of Trade (CBOT) in the 1980s. While Volume Profile measures the number of contracts traded at each price, TPO measures something different — the amount of time the market spent at each price.
The logic behind TPO is rooted in auction theory. In any auction, if a price is “fair,” participants will dwell there — they will transact, negotiate, and build inventory. If a price is “unfair” (too high for buyers or too low for sellers), the market will quickly move away. By tracking how long the market spends at each price level, TPO reveals which prices the market considers fair and which ones it considers extreme.
On NinjaTrader 8, Kaizen TPO renders the classic Market Profile directly on your chart. Each sub-period (typically 30 minutes) adds a column of TPO blocks at every price level the market touched during that sub-period. As the session progresses, the profile grows, and the structure of the day reveals itself.
How TPO Works
A TPO chart divides the trading session into sub-periods. The most common setting is 30-minute sub-periods, which is the traditional Market Profile convention, but many traders experiment with 15-minute or even 60-minute sub-periods depending on the instrument and their timeframe.
Here is how the profile builds:
-
During the first sub-period (call it period A), the market trades between 5245 and 5255. A TPO block is placed at every price level from 5245 to 5255. That is 11 price levels, each receiving one TPO count for period A.
-
During the second sub-period (period B), the market trades between 5248 and 5260. TPO blocks are placed at every price level from 5248 to 5260. The prices from 5248 to 5255 now have two TPO counts (one from A, one from B). The prices from 5256 to 5260 have one count.
-
This process continues throughout the session. By the end of the day, each price level has a count equal to the number of sub-periods during which the market visited that price.
The resulting histogram looks similar to a Volume Profile at first glance, but the numbers represent time, not volume. The key components:
-
TPO POC — The price with the highest TPO count, meaning the market spent more time at this price than any other. This is the “most fair” price according to the time-based auction.
-
TPO Value Area (VAH and VAL) — The range of prices containing approximately 70% of all TPO counts. This is the time-based value area.
-
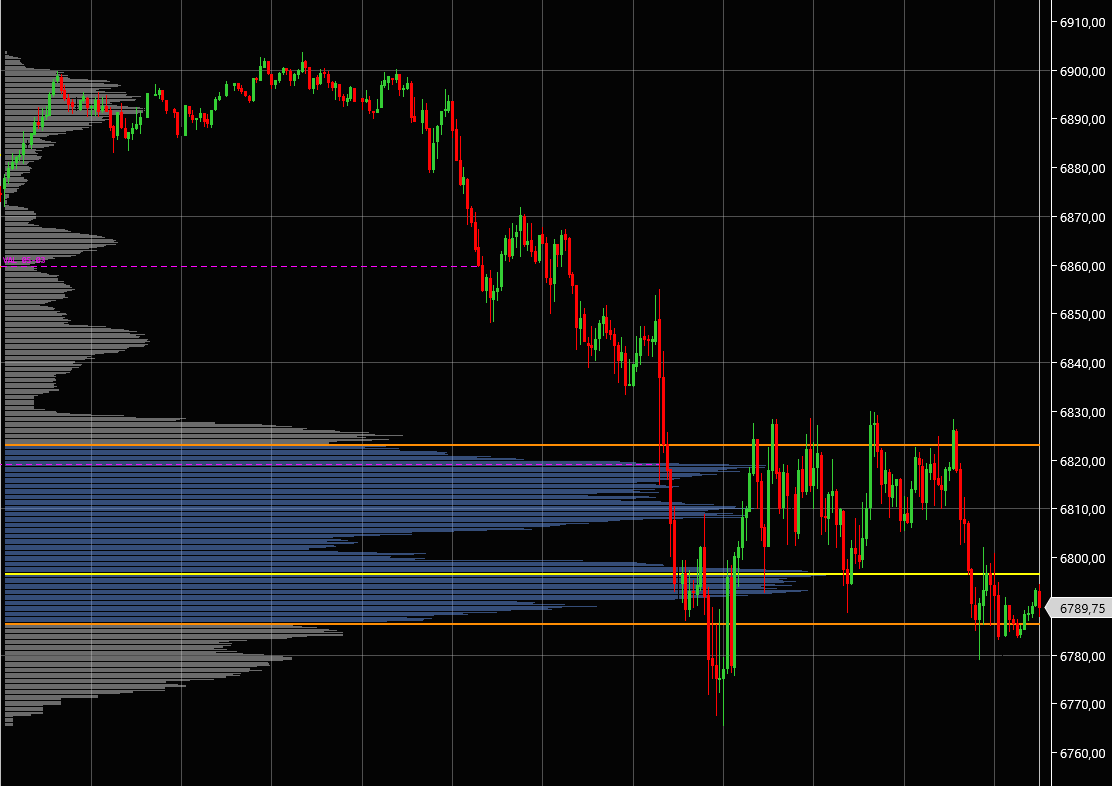
Single Prints — These are interior price levels that were visited during only one sub-period (TPO count of 1). Single prints are not at the extremes of the range — they occur within the body of the profile. A single print means the market touched that price exactly once and never came back. In auction theory, that price was never properly “auctioned.” It is considered an imbalance that the market is likely to revisit. Single prints are high-probability retest targets, and Kaizen TPO projects them as dashed lines until price finally retests them.
-
Initial Balance (IB) — The range of the first two sub-periods (typically the first hour of regular trading). The IB establishes the early value area. Whether the market extends above or below the IB — and by how much — is a classic Market Profile signal for day type classification.
Key TPO Patterns
TPO profiles fall into recognizable patterns that tell you what type of day is unfolding:
Normal distribution — The profile is roughly bell-shaped with a clear POC near the center. The market traded up and down within a range but kept returning to the middle. This indicates a balanced, rotational day. Mean-reversion strategies work well: buy at the VAL, sell at the VAH, target the POC. Normal distributions tend to happen when there is no major news catalyst and the market is digesting a prior move.
Trend day — The profile is elongated and thin. Instead of building a wide concentration at one price, the market spent one or two sub-periods at each level and then moved on. The POC may sit near one extreme of the range. A trend day on TPO is unmistakable — the profile looks like a tall, narrow column rather than a bell curve. When you recognize a trend day developing (the profile keeps extending in one direction without building width), the correct strategy is to stop fading and start joining the trend. Add on pullbacks; do not try to pick the top or bottom.
Double distribution — The profile shows two separate concentrations of time, each with its own local POC, separated by a thin area of single prints in the middle. This pattern tells you the market valued two different price zones during the session. Something — a news event, a large order, a shift in sentiment — drove price from one area to another and the market accepted both. Double distributions often precede breakouts because they represent a tug-of-war. The next session will likely resolve toward one value area or the other.
Recognizing these patterns in real time is a skill that develops with practice. The key is to watch how many TPO blocks are printing at the current price versus how quickly the profile is extending. If TPO blocks are stacking (building width), the market is accepting. If price is extending with only one or two blocks at each level, the market is exploring.
Volume Profile vs TPO — Key Differences
Now that you understand how each tool works individually, let’s compare them side by side.
| Aspect | Volume Profile | TPO Market Profile |
|---|---|---|
| Measures | Volume (contracts) at each price | Time (sub-periods) at each price |
| POC meaning | Price with the highest traded volume | Price where the market spent the most time |
| Best for | Support/resistance levels, breakout zones | Market structure, auction day-type classification |
| Resolution | Tick-level or minute-level accuracy | Sub-period blocks (e.g., 30-min increments) |
| Naked / Single levels | Naked levels (untested VP levels from prior sessions) | Single prints (interior levels visited only once) |
| Shape analysis | P-shape, b-shape, D-shape | Normal, Trend day, Double distribution |
| Speed of insight | Fast — volume accumulates with every tick | Develops over time as sub-periods complete |
| Scalping | Excellent — precise price levels for entries/exits | Good — provides context for day type |
| Swing trading | Good — daily/weekly profiles mark key levels | Excellent — multi-day value area migration |
| Learning curve | Medium | Medium to High |
Here is the crucial insight: Volume Profile tells you where the money is. TPO tells you where the time is. They often agree — the price with the highest volume is frequently the price where the market spent the most time. When they align, you have a high-confidence level.
But when they diverge, that is where the most interesting trades happen. Imagine a price level where the TPO count is high (the market spent many sub-periods there) but the volume is relatively low. That means traders were present at that price for a long time, but they were not transacting heavily. The market was “resting” there — perhaps waiting for a catalyst. Now imagine the opposite: a price level where volume is massive but the TPO count is low. That means a huge number of contracts changed hands in a very short time. Something drove aggressive trading at that price — a large institutional order, a stop run, a news spike. These divergences are clues to what is really happening beneath the surface.
Kaizen Volume Profile
professionalVolume-at-price histogram with POC, Value Area & Naked Levels
$179
Lifetime license
When to Use Volume Profile
Finding Support and Resistance
This is the bread and butter of any volume profile indicator. High Volume Nodes act as support and resistance because they represent prices where many market participants built positions. Those participants — whether they are profitable or underwater — will react when price returns to those levels.
Think about it from a positioning perspective. If 50,000 contracts traded at 5250 during Tuesday’s session, there are a lot of traders whose average entry price is near 5250. If price drops below that level and returns, some of those traders will add to their positions, others will exit at breakeven, and the net effect is that 5250 becomes a level where price will slow down and where reactions are likely.
LVNs, on the other hand, offer the opposite information. If very few contracts traded between 5261 and 5268, there is no accumulation to anchor price. When price enters that zone, it tends to accelerate. For a trader, LVNs are your “fast travel” zones — once price enters, expect a quick move to the next HVN.
A practical ES example: you pull up yesterday’s session profile and see an HVN at 5240 with 38,000 contracts. Today, price opens at 5255 and begins selling off. As price approaches 5240, you are not surprised to see it slow down, wick, and bounce. That HVN from yesterday’s profile is acting as support — exactly as expected.
Confirming Breakouts
One of the most valuable uses of a session volume profile is breakout confirmation. Not all breakouts are created equal, and volume profile helps you distinguish the real ones from the traps.
When price breaks through an LVN — a thin area on the profile — with increasing volume, that is a strong breakout. The lack of prior accumulation means there are few trapped traders to slow the move. The increasing volume means new participants are committing to the direction.
Conversely, when price approaches an HVN after a breakout, watch carefully. If the breakout stalls right at a High Volume Node from a prior session, that is a warning sign. The heavy prior volume at that price creates natural resistance. You might see price wick through the HVN, trigger stops, and then reverse — the classic trap.
Kaizen Volume Profile’s Naked Levels feature is particularly useful here. Naked levels are prior-session POCs, VAHs, or VALs that have never been retested. They sit on your chart as projected lines until price finally touches them. When price approaches a naked level, you know it is interacting with an untested zone of significance for the first time — making the reaction there likely to be pronounced.
Scalping with Session Profiles
For intraday scalpers, the developing session volume profile is a real-time roadmap. As the session unfolds, the POC, VAH, and VAL update with every trade. This gives you dynamic levels to work with:
-
Developing POC as a magnet: Price has a statistical tendency to return to the developing POC. If price has drifted away from the POC and the session is still in rotation mode, consider trades back toward the POC.
-
Value Area edges for entries: When price pushes to the VAH or VAL and the profile shape suggests a normal (D-shape) day, fading moves at those levels is a high-probability play. Enter a short near the VAH with a target at the POC. Enter a long near the VAL with a target at the POC.
-
LVN breakout scalps: When price pushes through a developing LVN within the session, hop on for a quick scalp targeting the next HVN or value area edge.
The key is matching your session profile read with the day type. If the profile is building a D-shape (balanced), scalp the edges. If the profile is extending unidirectionally (trend shape), stop fading and join the direction.
When to Use TPO
Reading Market Structure
The single greatest advantage of TPO over Volume Profile is its ability to classify the type of day you are in — and to do so while the day is still unfolding.
Here is why that matters. A balanced, rotational day and a trend day require opposite strategies. On a balanced day, you fade extremes and target the center. On a trend day, fading is a recipe for losses — you need to join the trend and hold. Misidentifying the day type is one of the most expensive mistakes a day trader can make.
TPO gives you the clearest read on day type. If, after the first three sub-periods (90 minutes of regular session), your TPO profile is building width at the center — multiple sub-periods stacking at the same prices — you are likely in a normal/rotational day. Set up your mean-reversion plays.
If the profile is extending in one direction with only one or two TPO blocks at each price level, you are in a trend day. Stop looking for reversals. Look for pullbacks to the most recently built cluster for entries in the direction of the trend.
If you see two separate clusters forming with a gap of single prints between them, a double distribution is developing. Recognize it, bracket the two value areas, and prepare to trade the breakout when one side wins.
This structural read is something that Volume Profile can suggest but that TPO makes explicit, because TPO directly measures the time dimension that defines day types.
Trading Single Print Targets
Single prints are one of the most underappreciated edges in Market Profile trading. A single print occurs when an interior price level is visited during only one sub-period and the market never returns to it during the session. That price was touched once and abandoned — it was never properly auctioned.
According to auction theory, an unfinished auction creates a “debt” that the market will eventually “pay.” In practical terms, single prints are high-probability retest targets. They may be revisited later in the same session, the next day, or several days later — but the market has a strong tendency to fill them.
Kaizen TPO projects single prints as dashed horizontal lines that extend forward until price retests the level. This turns single prints into actionable trade targets. When you see a cluster of single prints from yesterday’s session sitting below today’s opening price, you have a clear downside target if selling pressure develops.
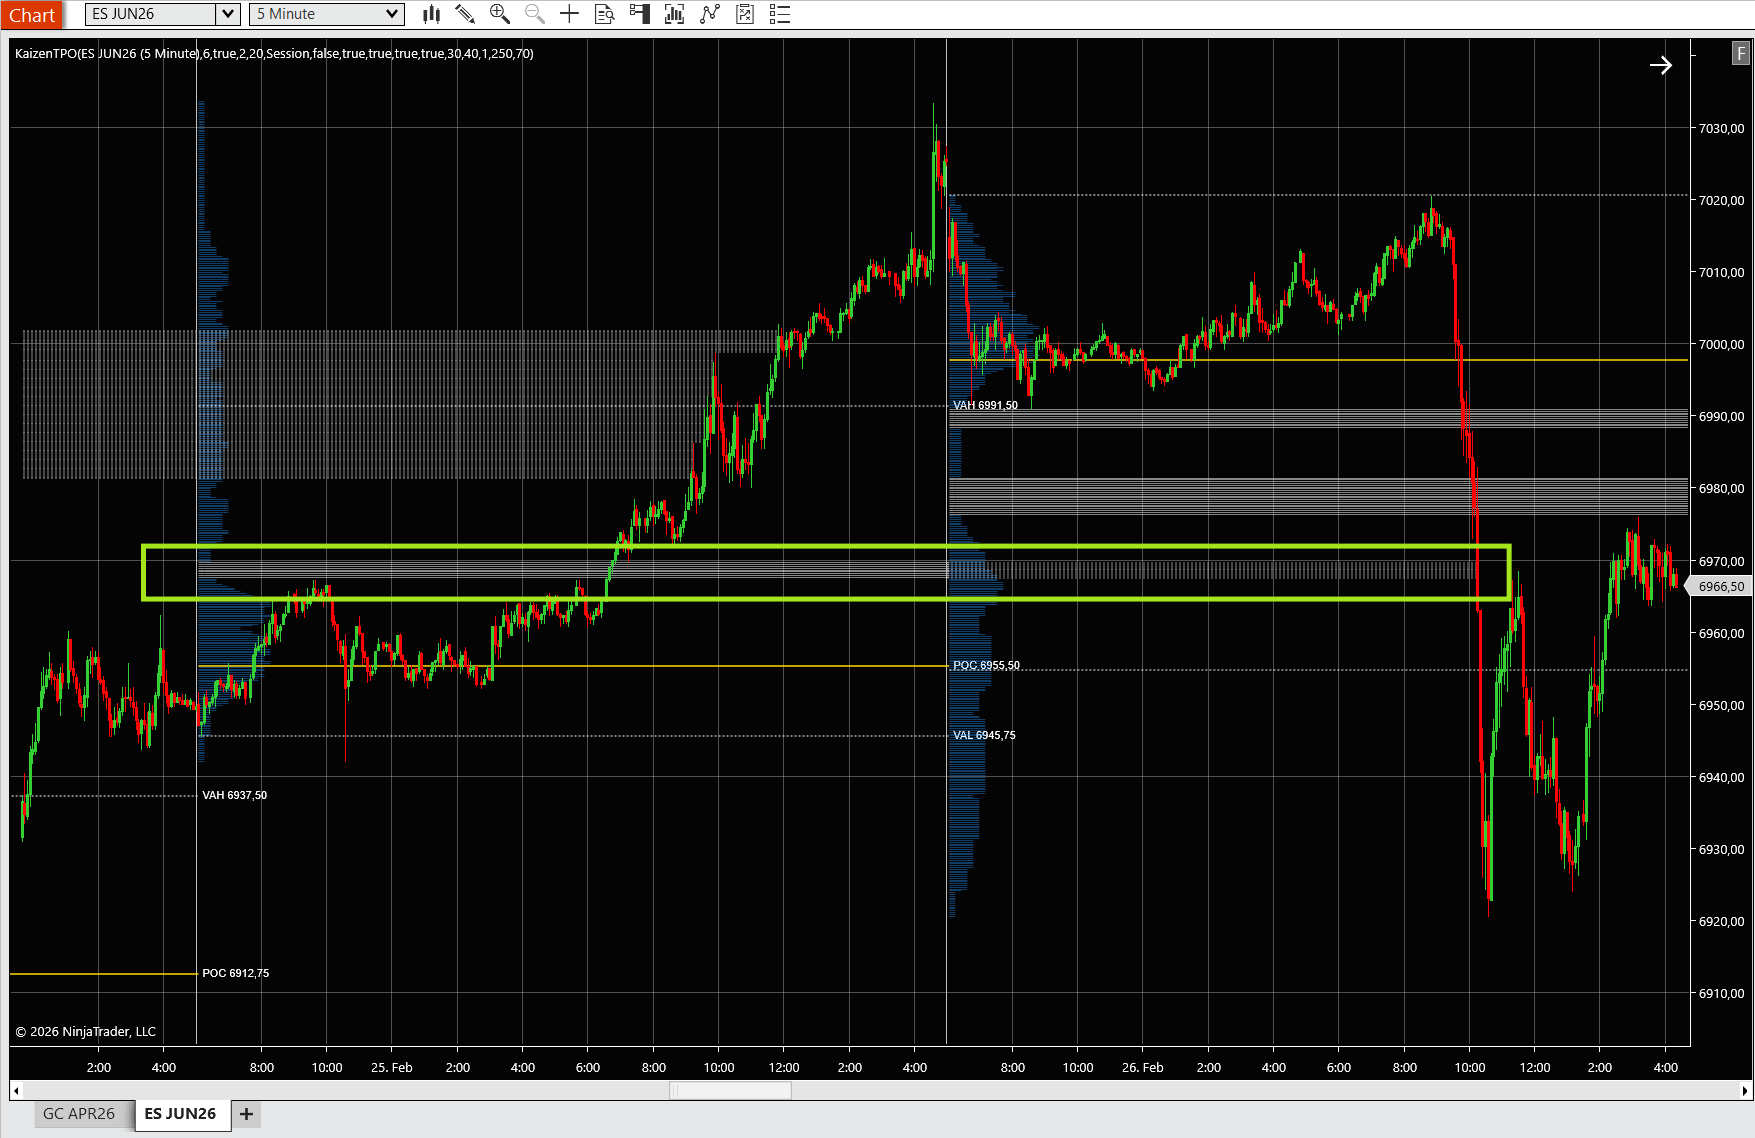
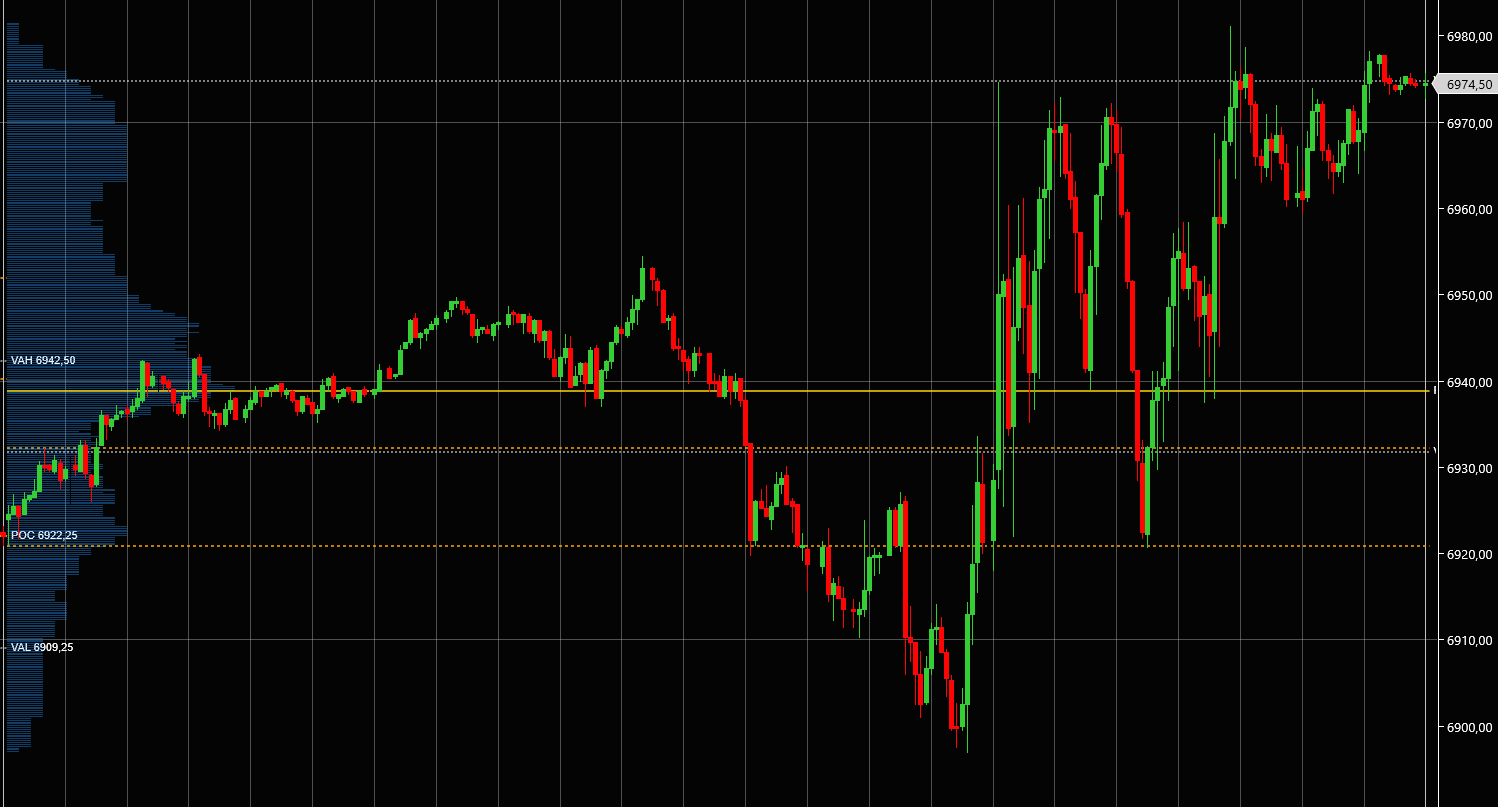
Example: Yesterday’s ES TPO profile shows single prints between 6967 and 6969. Today the market opens at 7014 and begins to sell off during the opening. You know that 6967–6969 is a magnetic target. If the selling persists, those single prints provide a logical profit target for shorts, and if price reaches them, the “auction debt” is paid and you can look for a bounce.
Multi-Day Auction Analysis
Where TPO truly shines is in multi-day analysis. By overlaying daily TPO profiles from the past week, you can track the migration of value over time. This gives you insight into the bigger auction that the market is conducting.
Value Area migration is the key concept. If Monday’s value area was 5220–5240, Tuesday’s was 5235–5255, and Wednesday’s was 5250–5270, the value area is migrating higher. Buyers are firmly in control of the multi-day auction. Each day, the market accepts higher prices as fair. In this environment, dip-buying on pullbacks to the prior day’s VAH is a strong strategy.
Conversely, if value areas are migrating lower, sellers are in control. Shorting rallies to the prior day’s VAL becomes the plan.
When value areas overlap significantly and are not migrating in either direction, the market is in a multi-day balance. The entire balance range becomes a consolidation zone. The eventual breakout from this balance — when one day’s value area finally shifts entirely outside the balance — can produce a powerful trending move.
This type of multi-day auction analysis is difficult to do with Volume Profile alone because VP does not capture the time structure of the auction as explicitly. TPO’s sub-period framework makes value migration and balance detection visually obvious.
Kaizen TPO
professionalMarket Profile with time-based price distribution & single print detection
$179
Lifetime license
Using Both Together — A Combined Strategy
The Confluence Approach
The most effective market profile traders do not choose one tool over the other. They use both, looking for confluence — situations where Volume Profile and TPO agree on a level’s significance.
When the VP POC and the TPO POC align at the same price, that level is extremely significant. It means the price attracted both the most volume and the most time. It is the market’s consensus on fair value, confirmed by two independent measurements. Support or resistance at that level will be strong.
When you find a level where VP shows a High Volume Node and TPO shows multiple sub-periods of printing (high TPO count), that level is a fortress. Fading a move into a confluence level — where both time and volume concentration agree — is one of the higher-probability trades available to a day trader.
Divergence is equally valuable. If the VP POC sits at 5250 but the TPO POC is at 5245, the market is telling you something nuanced. Perhaps a large institutional order drove heavy volume at 5250 in a single burst (high volume, low time), but the market organically spent most of its time at 5245 (high time, moderate volume). In this case, 5245 may be the more sustainable support level, while 5250 is more of a one-time event level.
Example: ES Session Analysis
Let’s walk through a hypothetical trading day on the ES (S&P 500 E-mini futures) using both Kaizen Volume Profile and Kaizen TPO.
Pre-market setup: You load your 5-minute ES chart with session Volume Profile and a separate panel with session TPO using 30-minute sub-periods. Yesterday’s profiles are visible as well. Yesterday’s VP shows a naked POC at 5248 and naked VAH at 5262. Yesterday’s TPO shows single prints between 5265 and 5270.
9:30 AM — Open: ES opens at 5252, inside yesterday’s value area. Both today’s VP and TPO begin building their profiles.
10:00 AM — First sub-period complete: The TPO A period covered 5248–5258. The developing VP POC is at 5254 with the heaviest volume there. So far, consistent — a normal open near yesterday’s fair value.
10:30 AM — Second sub-period: The TPO B period extends up to 5262 but price pulls back to 5255. The Initial Balance is now 5248–5262. Your developing VP POC has shifted to 5253 as more volume fills in there. The developing VAH is 5258, VAL is 5249.
11:00 AM — Reading the structure: Three sub-periods in, and the TPO profile is building width around 5252–5256 (three TPO blocks at those levels). This looks like a normal distribution forming. The VP profile agrees — a D-shape is developing with the heaviest volume near the center of the range. Your plan: fade moves to the edges of the developing value area.
11:30 AM — Trade setup: Price pushes up to 5260, near the developing VAH. The VP shows this is an LVN — relatively thin volume up here. The TPO has only one block at 5260. Confluence says this is an area of low acceptance. You enter a short at 5260 with a stop at 5264 (above the Initial Balance high) and a target at the developing POC around 5253.
12:15 PM — Target hit: Price rotates back down to 5253, hitting your target. The developing VP POC is confirmed at 5253 as volume continues to concentrate there. The TPO profile is widening nicely at the center — this is clearly a normal day.
1:30 PM — Upside target appears: Price pushes above 5262 (yesterday’s naked VAH). You note that yesterday’s single prints at 5265–5270 are now in play. The VP profile shows an LVN above 5262. If this breakout holds, the single print targets at 5265–5270 give you a long target.
This is the power of using both profiles together. The VP gives you precise levels for entries and stops. The TPO gives you the structural context to know whether to fade or follow, and single prints give you projected targets.
Recommended Setup on NinjaTrader 8
For the combined approach, here is how to configure your workspace:
Primary chart — 5-minute ES with Kaizen Volume Profile in Session mode: This is your real-time action chart. The session VP updates tick by tick, giving you the developing POC, VAH, VAL, and any emerging HVNs or LVNs. Enable Naked Levels so you can see unretested levels from prior sessions projecting forward.
Secondary panel — Kaizen TPO in Session mode with 30-minute sub-periods: This panel gives you the structural context. You can see the day type developing (normal vs. trend vs. double distribution), the Initial Balance, and any single prints. Enable Single Prints and Extend Single Prints so they project as dashed lines until retested.
Optional — Daily VP on a higher-timeframe chart: If you swing trade or want to see the bigger picture, add a daily Volume Profile to a 30-minute or 60-minute chart. This shows you where the major volume concentration occurred over the past 5–10 sessions and where the dominant naked levels sit.
You can also use VWAP alongside both profiles. VWAP gives you the average price weighted by volume, which complements the VP’s POC. When VWAP and VP POC are close, that level has extra gravity.
Setting Up Both on NinjaTrader 8
Getting the right settings dialed in makes a significant difference. Here are the recommended configurations for both indicators.
Volume Profile Settings
- Mode: Session — this gives you a fresh profile for each trading session, which is the most useful mode for day trading.
- Accuracy: Tick (if Tick Replay is enabled in NinjaTrader’s Data Series settings). This gives you the most precise volume distribution because every individual tick is counted at its exact price. If you cannot enable Tick Replay, use Minute accuracy — it is slightly less granular but still effective.
- Value Area Percentage: 68% — the standard setting that mirrors the statistical normal distribution. Some traders use 70%, which is the traditional Market Profile convention. Either works; just be consistent.
- Show Naked Levels: True — this projects unretested POCs, VAHs, and VALs from prior sessions forward on your chart. These are some of the most powerful support/resistance levels available.
- Lookback Profiles: 5 — this shows the current session plus the four prior sessions, giving you enough context to see where the multi-day naked levels sit without cluttering the chart.
- Color scheme: Use a high-contrast color for the POC line (e.g., bright cyan or yellow) and muted colors for the histogram so that the key levels pop visually.
TPO Settings
- Mode: Session — same reasoning as VP. A fresh profile per session for day trading.
- Sub-period Duration: 30 minutes — the traditional Market Profile convention. This gives you roughly 13 sub-periods during a full RTH (Regular Trading Hours) session on ES. Some traders prefer 15-minute sub-periods for more granularity, especially on faster instruments like NQ.
- Value Area Percentage: 70% — the traditional Market Profile value area percentage. Note that this is slightly different from the VP convention of 68%. The 70% figure comes from the original Steidlmayer methodology.
- Show Single Prints: True — this highlights interior levels with only one TPO count, which are your retest targets.
- Extend Single Prints: True — this projects single print levels forward as dashed lines until price retests them, keeping them visible on your chart as actionable targets.
- Initial Balance highlight: If available, enable this to clearly see the range of the first two sub-periods. The IB is a key reference for day type classification.
Take five minutes to set these up before your trading session. Once configured, save your NinjaTrader workspace template so you can reload it instantly every day.
Bundle & Save
Market Profile Pack
Volume & time-at-price analysis
$349
$735
Save 53%
Frequently Asked Questions
What is the difference between volume profile and market profile?
Volume Profile measures the number of contracts (volume) traded at each price level, while TPO Market Profile measures the amount of time the market spent at each price level. Both create a histogram along the price axis, and both identify a Point of Control and Value Area — but Volume Profile’s POC is the highest-volume price, and TPO’s POC is the most-time-spent price. Volume Profile is better for pinpointing precise support/resistance levels driven by institutional accumulation, while TPO Market Profile excels at reading market structure and classifying what type of trading day is developing.
Which is better, volume profile or TPO?
Neither is inherently “better” — they answer different questions about the market. Volume Profile answers “where did the most trading activity happen?” TPO answers “where did the market spend the most time?” For precise support and resistance levels and for scalping, most traders prefer Volume Profile because it reacts instantly to each tick. For understanding the structure of the trading day (normal vs. trend vs. double distribution) and for multi-day auction analysis, TPO provides insights that Volume Profile does not capture as clearly. The best traders use both together, looking for confluence when both tools agree on a level and for divergence when they disagree — because divergence reveals hidden information about institutional behavior.
What is a single print in market profile?
A single print is an interior price level on a TPO Market Profile that was visited during only one sub-period (typically one 30-minute block) and never revisited during the session. Single prints are not the same as the high or low of the day — they occur within the body of the profile. According to auction market theory, a single print represents an unfinished auction: the market touched that price only once and moved away before it could be properly auctioned. This creates a “debt” that the market tends to repay by revisiting that price in the future. Traders use single prints as high-probability retest targets, often entering trades that target clusters of unfilled single prints from prior sessions.
Can I use volume profile for swing trading?
Yes. While session volume profiles are most commonly used for day trading, daily and weekly volume profiles are powerful tools for swing traders. A daily volume profile shows you the POC and Value Area for each trading day over the past several weeks. The naked POCs and naked VAHs/VALs from those daily profiles become significant swing-level support and resistance. A weekly volume profile is even more powerful — it shows where the most volume concentrated over an entire week, revealing the key levels that larger, slower-moving participants are defending. For swing trading, load a daily volume profile on a 30-minute chart with 10–20 sessions of lookback, enable Naked Levels, and use those projected levels as your entry and exit framework.
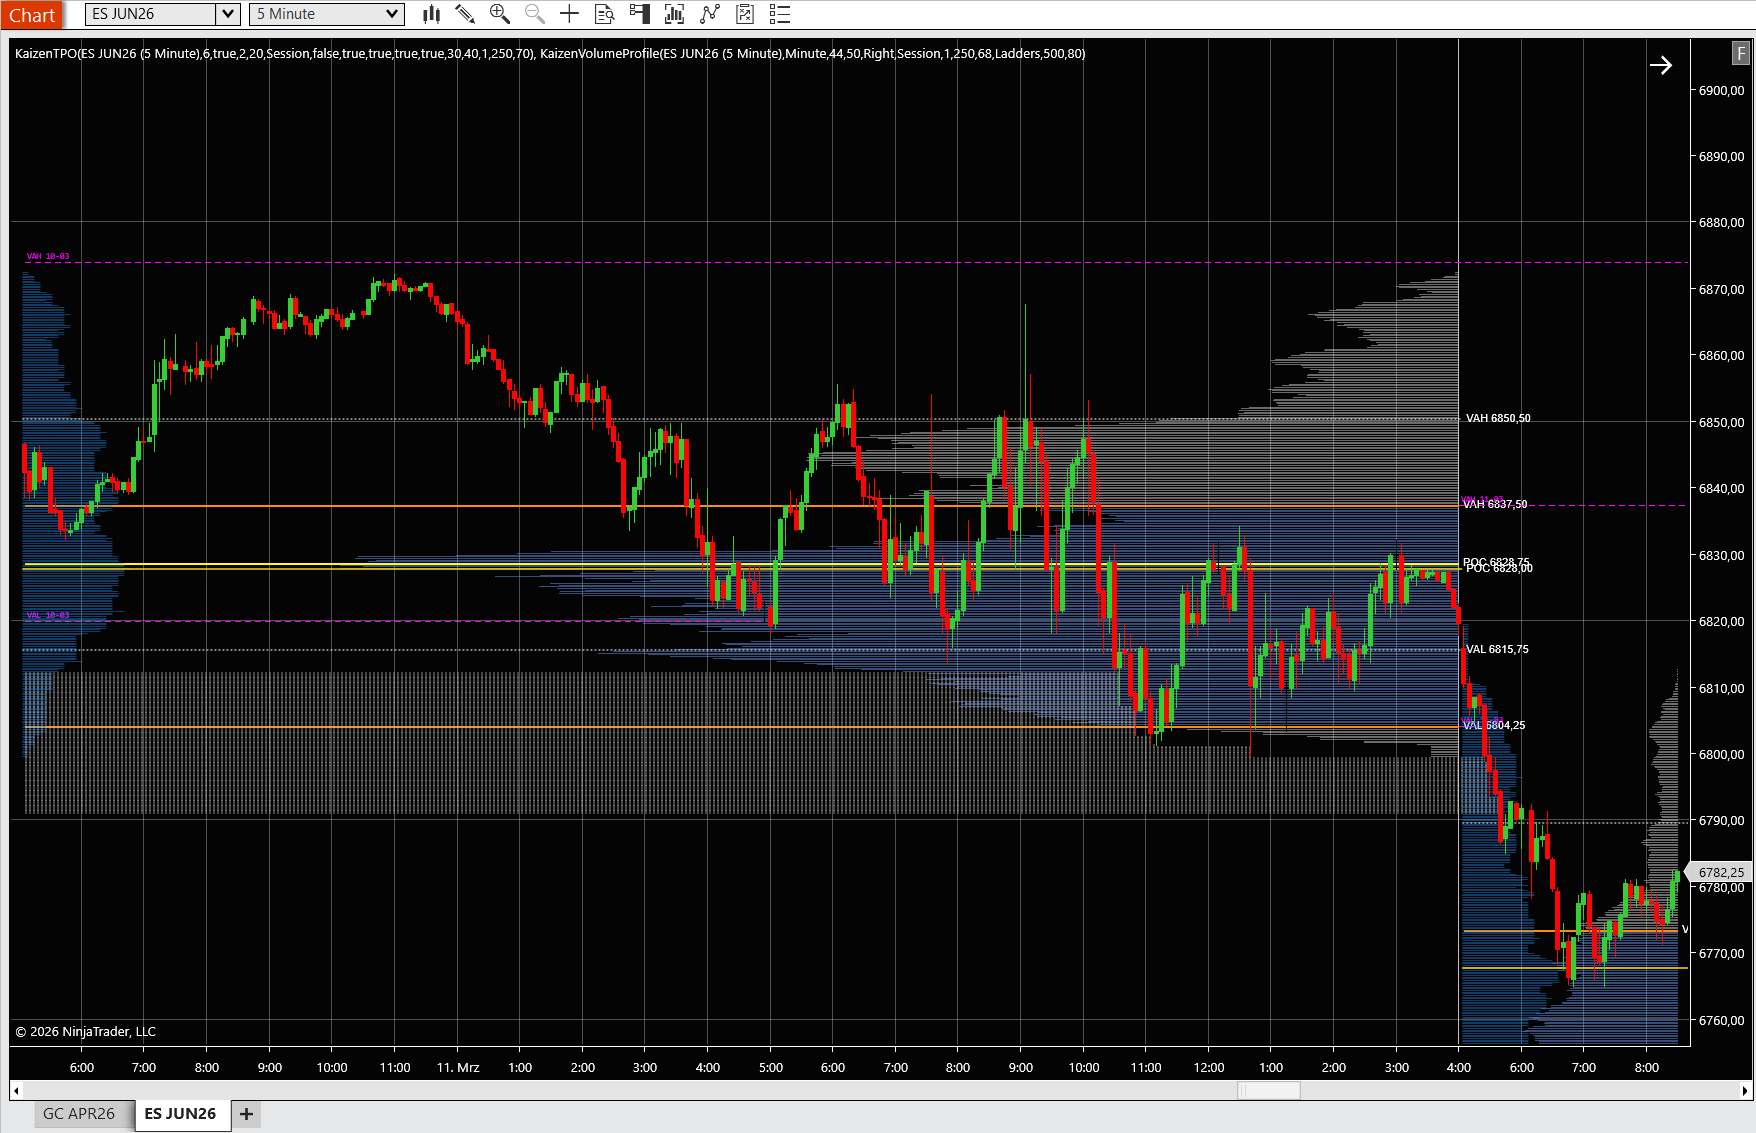
How do I combine volume profile and TPO on NinjaTrader 8?
The simplest approach is to run two chart panels side by side or stacked. On your primary chart (e.g., ES 5-minute), load Kaizen Volume Profile in Session mode for real-time support/resistance levels. On a secondary panel, load Kaizen TPO in Session mode with 30-minute sub-periods for market structure and day type classification. Both panels should show the same instrument and time range so you can cross-reference levels. Look for confluence (VP POC and TPO POC at the same price = high-confidence level) and use TPO single prints as directional targets when trading off VP levels.