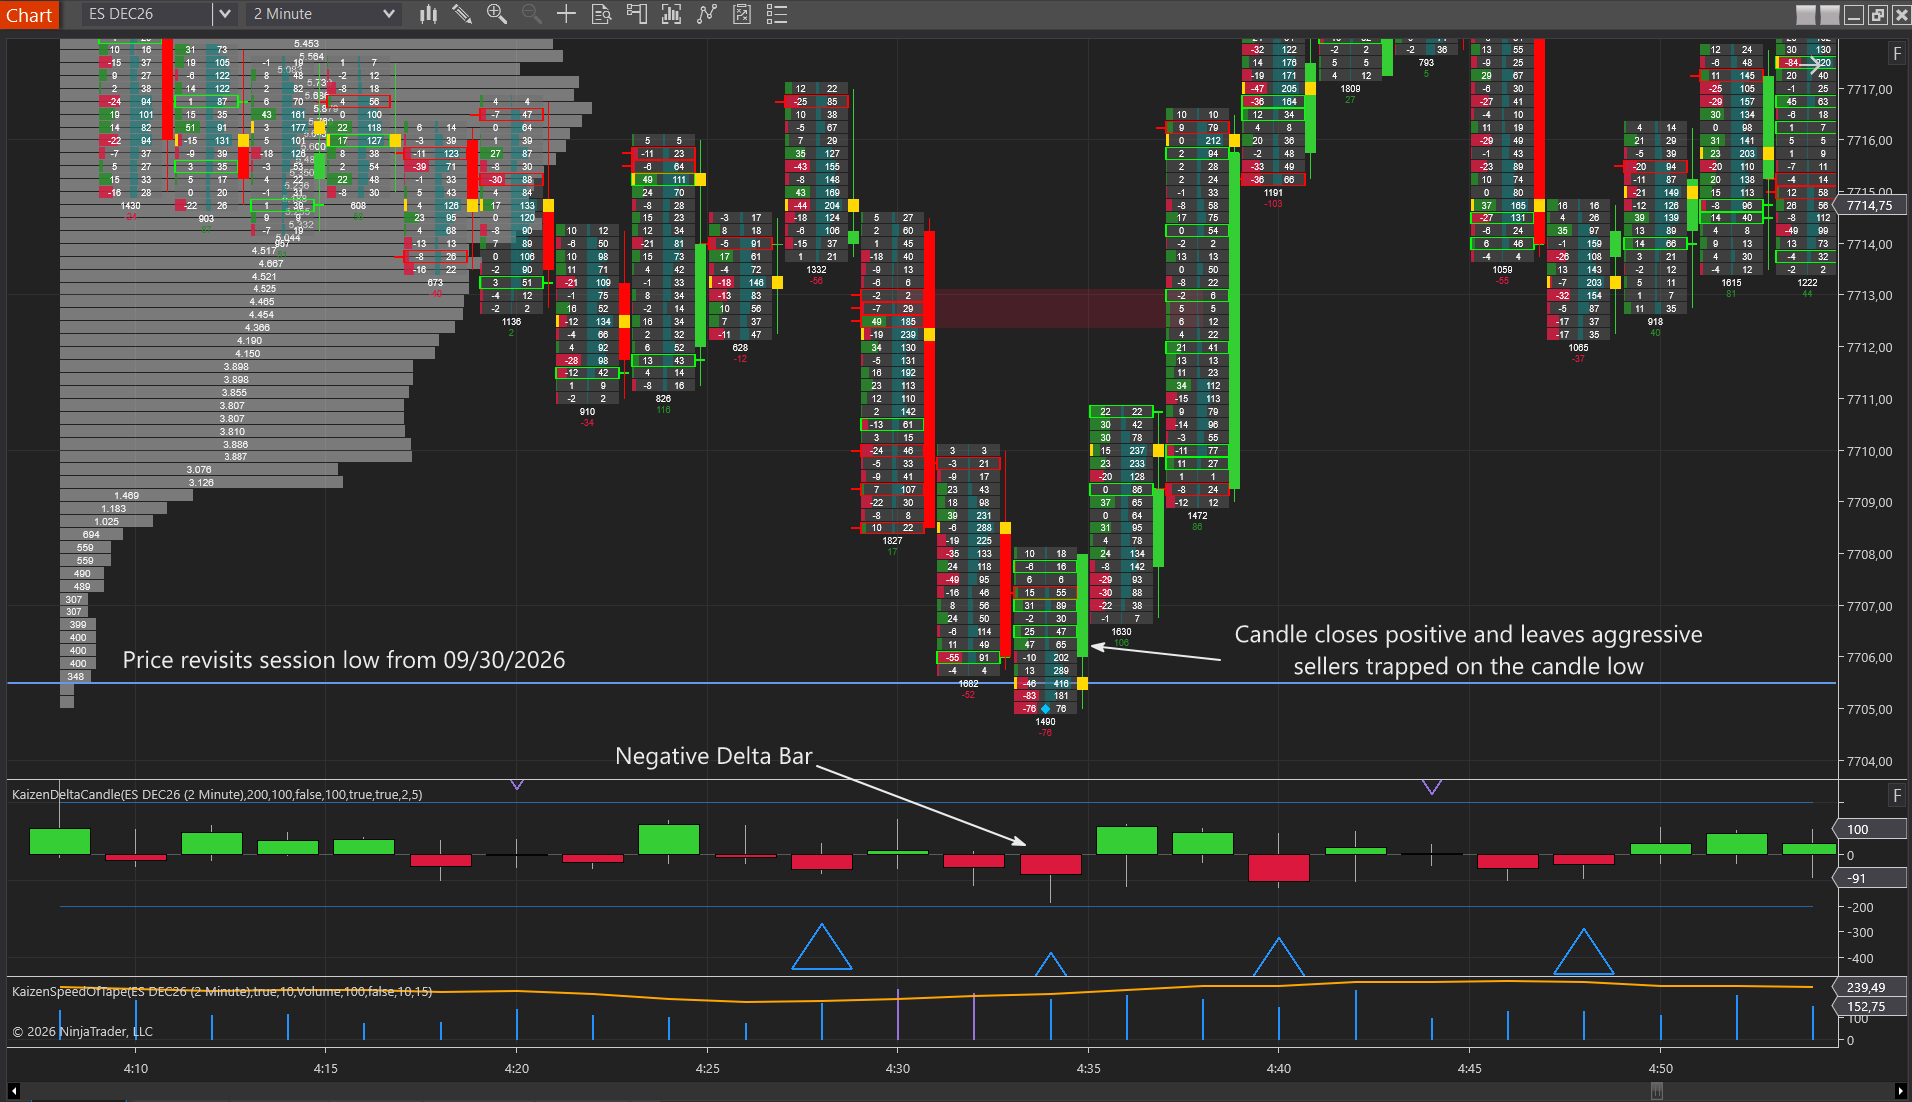
Absorption is when aggressive orders keep hitting a price and the price refuses to move, because someone on the other side keeps absorbing them. Buyers lift the offer at a prior high again and again. The delta climbs. And the candle goes nowhere, because a large seller resting at that price fills every single lift. Absorption is one of the most important things order flow can show you, because it reveals a participant big enough to stop the market, and it is invisible on a plain price chart. This guide explains what absorption is, how it looks on the footprint, delta, big trades and the tape, how it differs from exhaustion, and how to read it without mistaking it for a signal.
What Absorption Is
Every trade has an aggressive side and a passive side. The aggressive side crosses the spread with a market order because it wants to trade now. The passive side rests a limit order and waits for the market to come to it. Normally the aggressive side moves price: enough buying at the ask empties the offer, and the next offer is higher.
Absorption is what happens when the passive side is big enough that it does not empty. Buyers lift the offer at 4,510.00, and there is still an offer at 4,510.00. They lift it again; it is still there. Whether the seller is showing all of its size or refilling it quietly with an iceberg order, the effect is the same: aggression keeps arriving and price keeps failing to leave the level.
That tells you two things. Someone with real size has decided this price is worth defending. And the aggressive buyers are accumulating a position they may soon have to get out of.
How Absorption Shows Up
Absorption leaves a fingerprint on every order flow tool, and the strongest reads come when several agree.
On the footprint
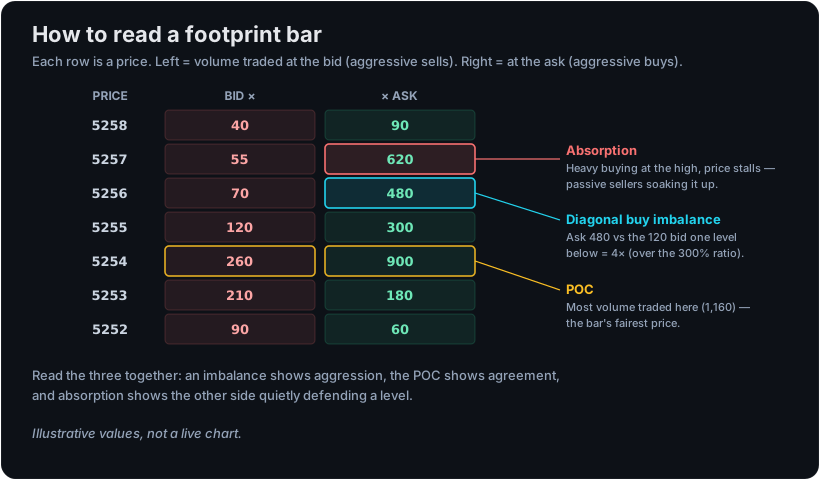
The footprint shows volume at bid and at ask for every price inside every bar. Absorption looks like a price level with unusually heavy volume where the aggressive side dominates, far more at the ask than at the bid for buying absorption, and yet the bar does not progress beyond it. Often the next bar or two stall at the same price or close back against the aggression. The volume says buyers were pressing hard; the price says it did not work.
On delta
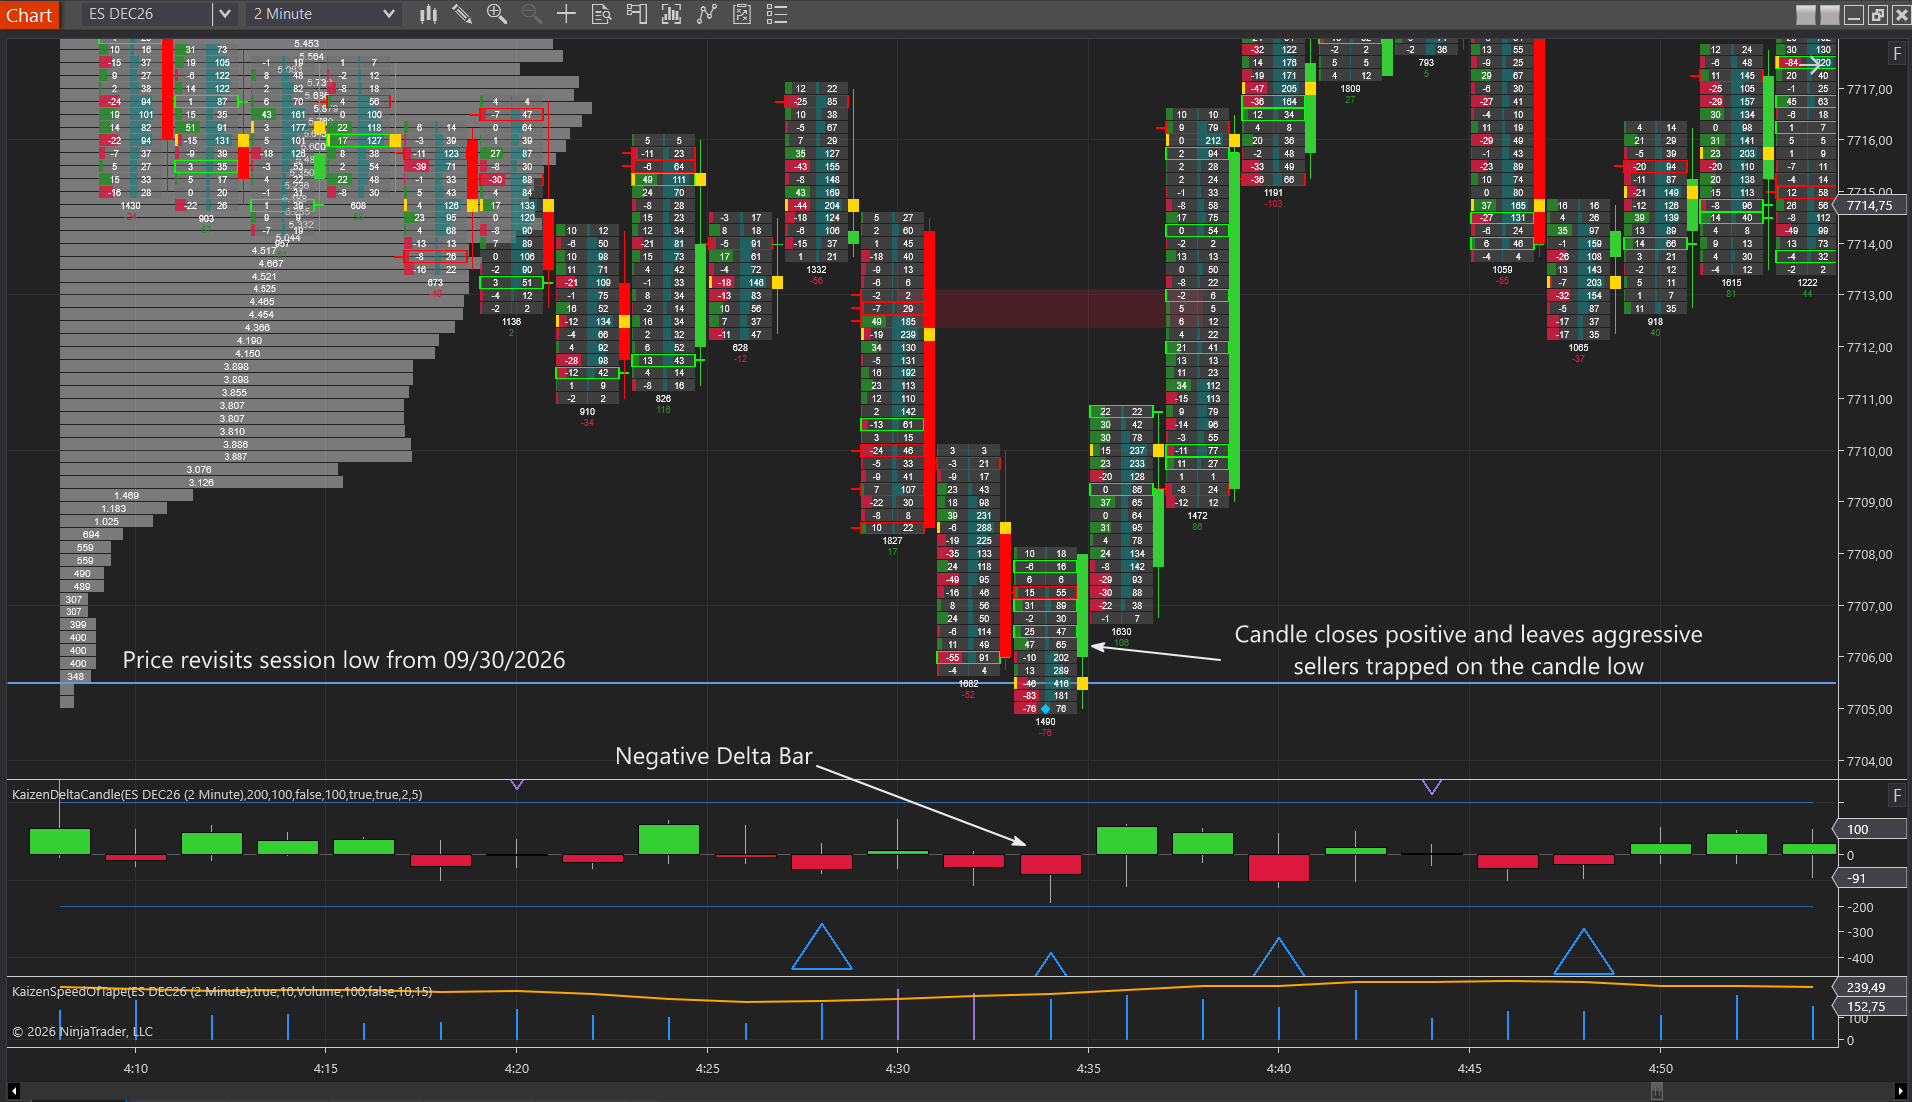
Delta is aggressive buying minus aggressive selling, so absorption produces a specific contradiction: strong delta in one direction on a bar that closes flat or against it. Kaizen Delta Candle plots each bar’s delta as its own candle and flags exactly these bars, a per-bar divergence between delta and price. On cumulative delta, the same thing looks like CVD pushing higher while price sits still, one of the sources of the delta divergence that forms at defended levels.
On big trades and the tape
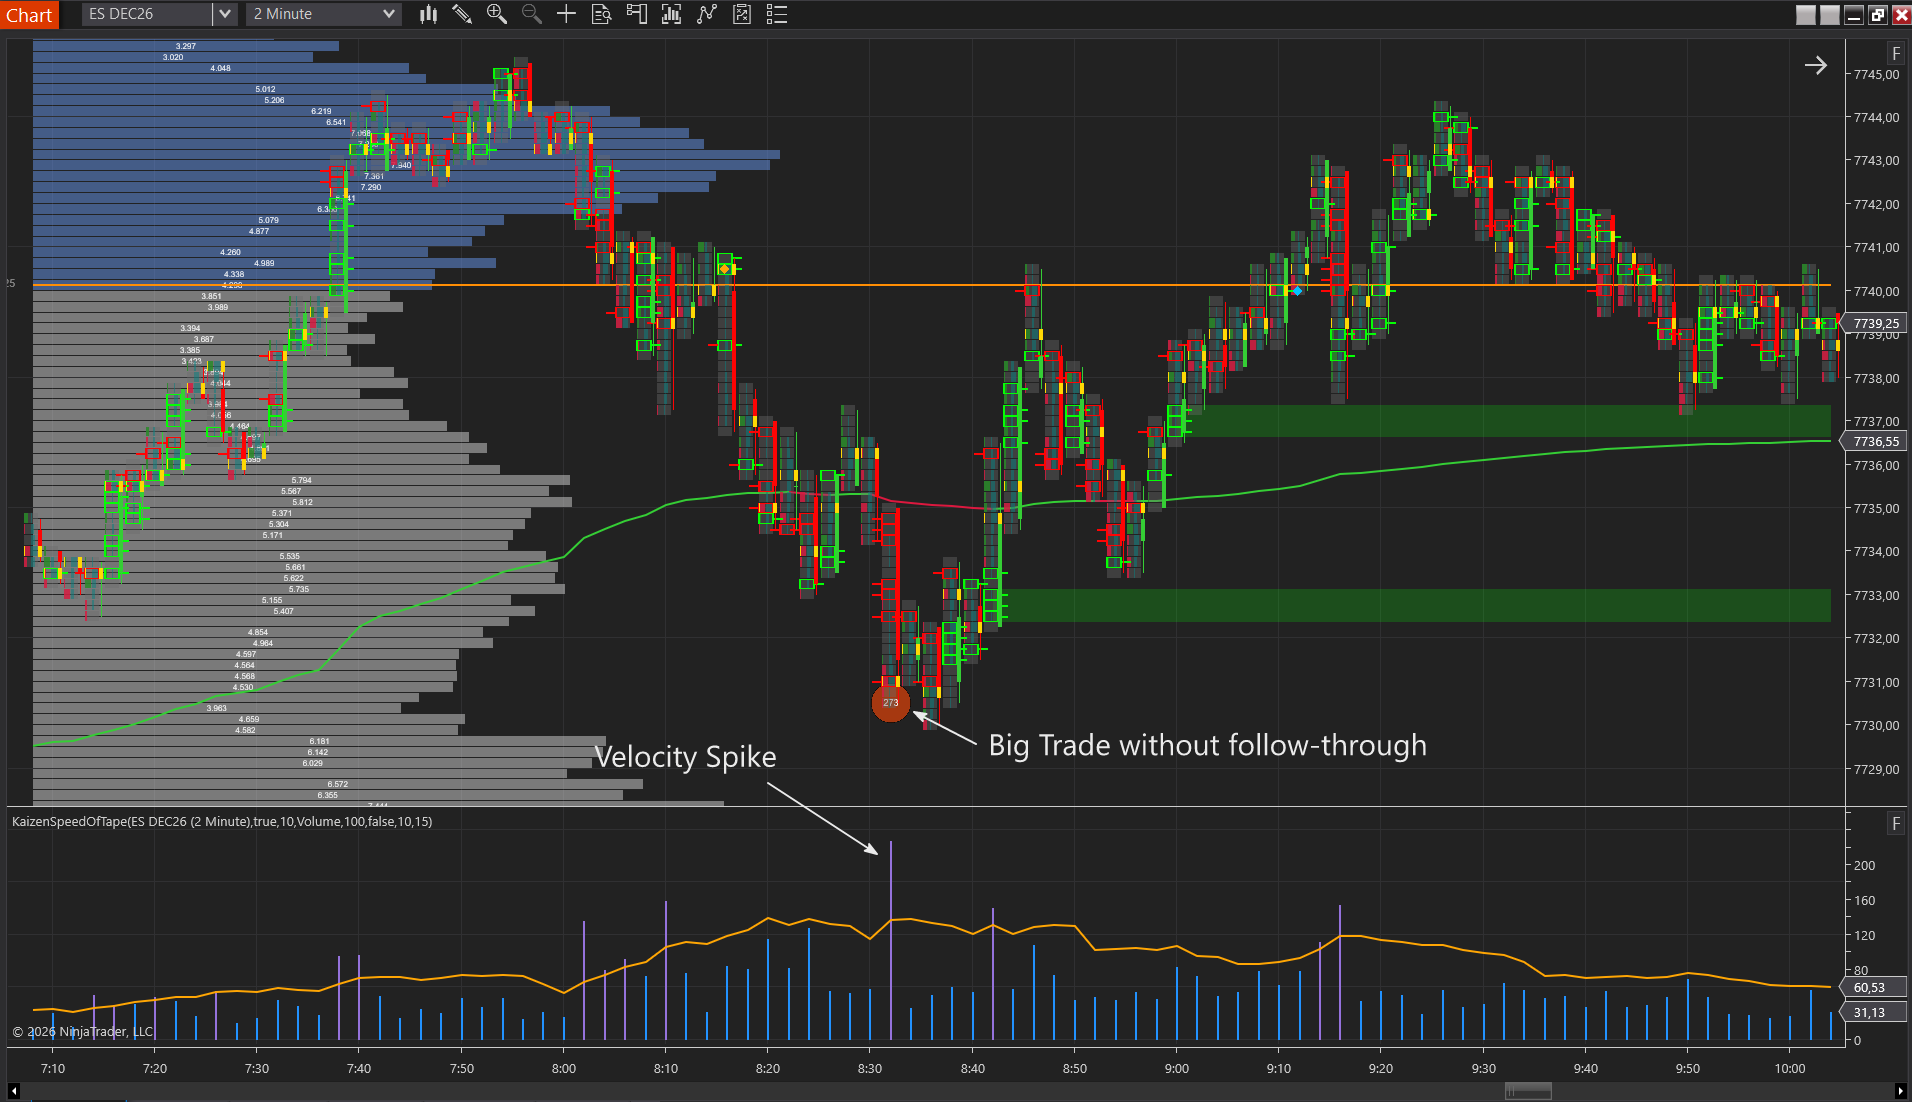
Large participants leave large prints. Kaizen Big Trades marks trades above a size threshold on the chart, and absorption often shows as a cluster of them at one price while the candle stalls: big aggressive orders hitting a wall. Kaizen Speed of Tape adds the tempo, a spike in trade velocity at the same moment, which is the sound of aggression arriving faster than price can respond to it.
On the DOM
On the depth of market, absorption is visible size that refuses to shrink, or size that reappears after each fill. It is the most direct view but also the easiest to fake with orders that pull before they are hit, which is why the printed tools above, which only show trades that actually happened, are the more reliable evidence.
Absorption vs Exhaustion
Both absorption and exhaustion tend to appear before a move turns, and they are easy to confuse because both end with the aggressive side failing. But their signatures are opposite, and the difference changes what you think is happening.
- Absorption is heavy volume and strong aggression with no progress. The attackers are as active as ever; a defender is simply bigger. It says a specific participant is defending a specific price.
- Exhaustion is fading volume and shrinking delta on each successive push. Nobody is defending anything; the attackers are running out of participants. Each new high or low carries less conviction than the last.
Absorption points to a wall. Exhaustion points to an empty room. A wall can be broken; an empty room can refill. Reading which one you are looking at tells you whether to expect a fight at the level or a slow fade away from it.
What Usually Happens After Absorption
Two things, and honesty requires putting them side by side.
The absorbed side gives up. The aggressive buyers stop lifting, the defender stops needing to sell, and price moves away from the level, frequently fast, because the buyers who accumulated a position into the wall now have to exit. This is the outcome absorption is famous for.
The absorption breaks. The passive side gets overwhelmed or pulls its remaining size, the level gives way, and price accelerates through it, now with the defender’s fills trapped on the wrong side. This is not a rare exception. It is roughly the other half of what happens, and it is why absorption on its own is never an entry.
The difference between the two is decided by confirmation from price, not by the absorption itself. That is the whole reason order flow traders wait.
Reading Absorption in Context
Location first. Absorption matters at prices someone has a reason to defend: a prior day’s high or low, the overnight high or low, a point of control or value area edge, a naked level. Absorption on a random mid-range price is usually just a large order being worked and means little. Our guide to how to read order flow walks through a full level-by-level read.
Then confirmation. Wait for price to tell you which resolution is happening. A move away from the absorbed price, with the aggressive side visibly giving up, confirms the hold. A close through the level, with the defender’s size gone, confirms the break. Entering before that is guessing which way the coin lands.
Then risk. If trading the hold, the risk sits beyond the absorbed price, because a trade through it means the read was wrong. If the read fails, it fails at a known cost.
Kaizen Footprint
flagshipFull bid×ask footprint chart with imbalances, stacked zones & unfinished business
$249
Lifetime license
Bundle & Save
Order Flow Pro
The complete order flow toolkit
$449
$1163
Save61%
A Realistic Word on Expectations
Absorption is one of the few things order flow shows you that price simply cannot: a participant large enough to stop the market, and the exact price it chose to do it. That is real information. It is also inference, because you are reading the footprint of an order you cannot fully see, and it resolves in both directions. Use it to identify levels worth watching, confirm with price, define your risk before you act, and remember that a level defended all morning can give way in one push. Everything here is educational and not financial advice. Practicing these reads on NinjaTrader’s Market Replay, tick by tick, is the fastest way to learn what absorption actually looks like before it resolves.
Frequently Asked Questions
What is absorption in trading?
Absorption is when aggressive market orders keep hitting a price and the price refuses to move, because passive limit orders on the other side keep absorbing them. Buyers lift the offer again and again, but a large seller resting at that price fills every lift. It shows up as heavy volume and strong delta at one price with no price progress, and it usually means a significant participant is defending that level.
How do you spot absorption on a footprint chart?
Look for a price level with unusually heavy volume where the aggressive side dominates, for example far more volume at the ask than at the bid, and yet price fails to move beyond it on the following bars. The candle stalls or closes back against the aggression. Delta candles that close against the bar’s direction and clusters of large prints at the same price confirm the same thing.
What is the difference between absorption and exhaustion?
Both precede turns, but they have opposite signatures. Absorption is heavy volume and strong aggression with no progress: the aggressive side is being met by a large passive side. Exhaustion is fading volume and shrinking delta on each successive push: the aggressive side is simply running out of participants. Absorption points to someone defending a price; exhaustion points to nobody left to attack it.
Is absorption a reversal signal?
Not on its own. Absorption tells you a level is being defended, which often precedes a move away from it, but absorption also breaks: the passive side gets overwhelmed, the level fails, and price accelerates through it. Traders treat absorption as a reason to watch a level closely and wait for price to confirm which way it resolves, with risk defined beyond the absorbed price.
What causes absorption?
Usually a large participant that wants to build or exit a position without moving price against itself. Rather than paying up with market orders, it rests limit orders at a price and lets the aggressive side come to it, often hiding the full size with iceberg orders that refill as they are filled. Institutional passive execution at levels is the most common source.
Want to see absorption as it happens? Kaizen Footprint shows the volume at every price, Kaizen Delta Candle flags the bars where delta and price disagree, and Kaizen Big Trades and Kaizen Speed of Tape show the large prints and the tempo behind them. All four are part of the Order Flow Pro bundle. Compare everything on the pricing page.