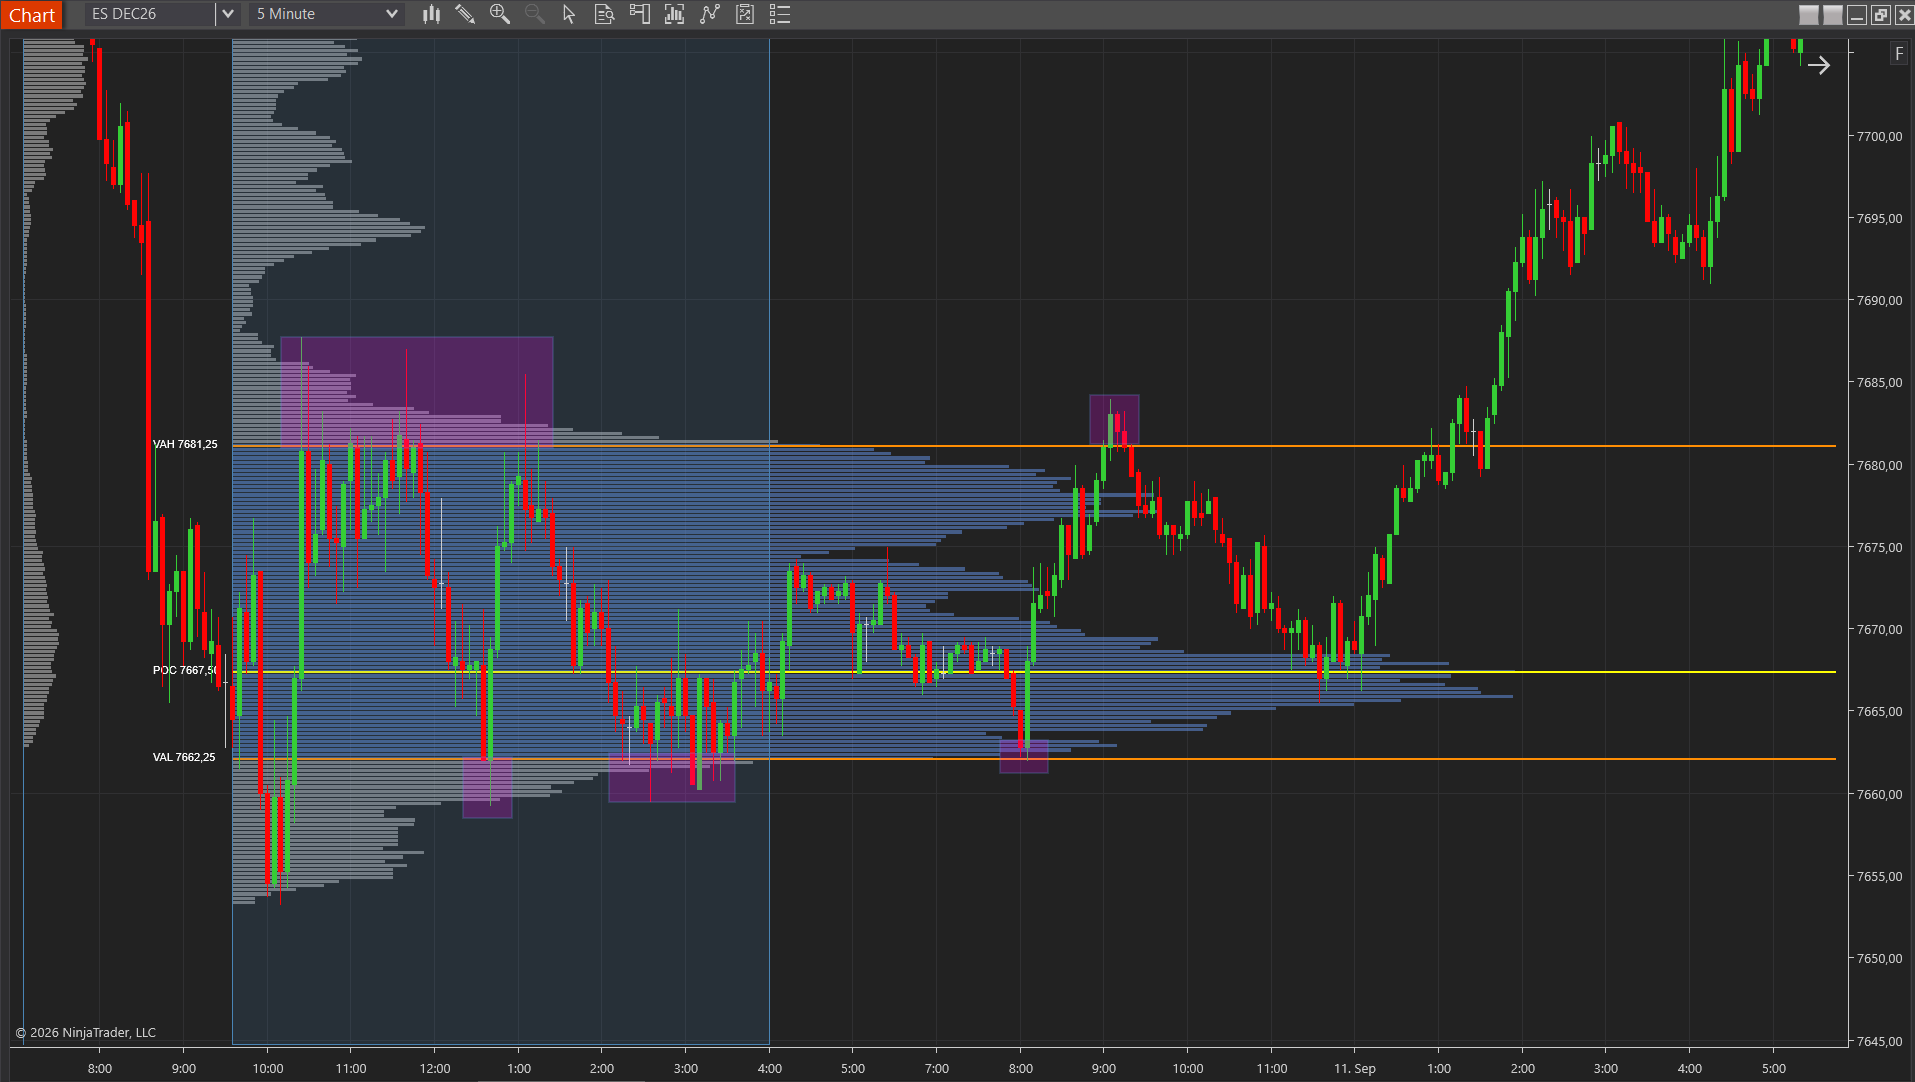
The point of control is the price where the market did the most business, and the value area is the range around it where roughly 70% of that business happened. Between them they answer a question price alone cannot: not just where price went, but where the market actually agreed on value. This guide explains what the POC, value area high and value area low are, how they are calculated from volume and TPO profiles, and the practical ways traders use them on NinjaTrader 8.
If you are new to profiles, it helps to know that both tools come from the same idea. A volume profile counts contracts traded at each price. A TPO chart counts time spent at each price. Both produce a histogram, and both use the same vocabulary: point of control, value area high, value area low.
What Is the Point of Control?
The point of control (POC) is the single price level in a profile with the most activity. On a volume profile it is the price where the most contracts changed hands. On a TPO profile it is the price that was touched in the most 30-minute periods.
Whichever version you use, the interpretation is the same. The POC is the price the market accepted most readily, the level where buyers and sellers were most comfortable doing business. In auction-theory terms it is the session’s fairest price. That is why it so often acts as a magnet while the session is developing, and as a reference level, support or resistance, afterward.
What Is the Value Area?
The value area is the band of prices around the POC that contains roughly 70% of the session’s total volume (or TPOs). Its top is the value area high (VAH) and its bottom the value area low (VAL).
The calculation is simple. Start at the POC. Look at the price level just above it and the one just below it, and add whichever has more volume. Repeat, always adding the larger neighbor, until the included levels hold about 70% of the total. The highest included price is the VAH, the lowest is the VAL.
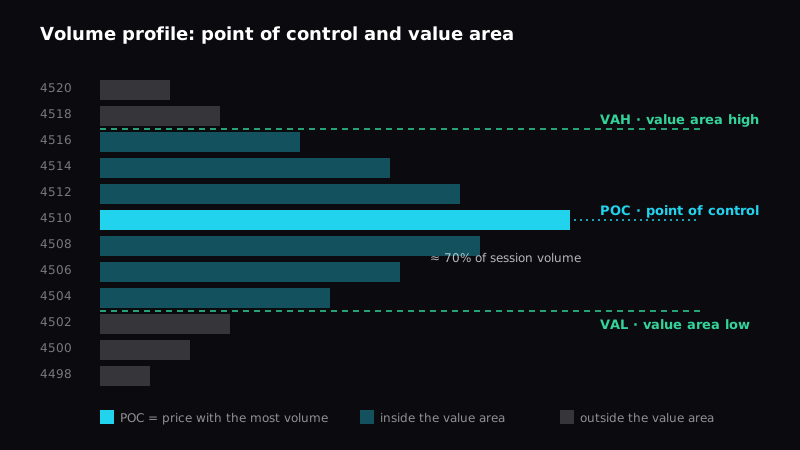
Why 70%? It is a convention that roughly matches one standard deviation of a normal distribution, where about 68% of the data sits within one standard deviation of the mean. Some traders use 68% or 70%, and most platforms let you change it, but 70% is the standard you will see almost everywhere.
The value area matters because it separates two kinds of price. Inside it, the market found acceptance: it traded there repeatedly and both sides kept participating. Outside it, price was rejected or is exploring, which is a different, less balanced condition.
Volume POC vs TPO POC
Because volume and time are different things, a volume profile and a TPO profile of the same session can put the POC in slightly different places.
- A volume POC is driven by contracts. A price that was hit once by a huge burst of trading can become the POC even if price spent little time there.
- A TPO POC is driven by time. A price the market kept returning to across many 30-minute periods becomes the POC even if volume at each visit was modest.
On a normal, balanced day the two sit close together. On fast, one-directional days they can separate, and that difference is itself information: it tells you whether the session’s fair price was defined by how much traded or by how long price stayed. The volume profile vs TPO comparison goes deeper on when to use which.
Why These Levels Matter
The POC and value area are useful because they describe the auction rather than just the chart. Markets move to find where business can be done and then spend most of their time there. The value area is that “there”. The POC is its center. Everything outside it is the market probing to see whether value has moved.
That framing turns three questions into levels you can watch. Where is the market’s current fair price? The POC. Where does accepted value end? The VAH and VAL. Is the market balanced or exploring? Inside the value area it is balanced; outside it, it is either about to get rejected back in or about to establish new value. Our guide to what order flow is explains the buyer-versus-seller mechanics underneath this.
How Traders Use the POC and Value Area
The POC as a magnet and a level
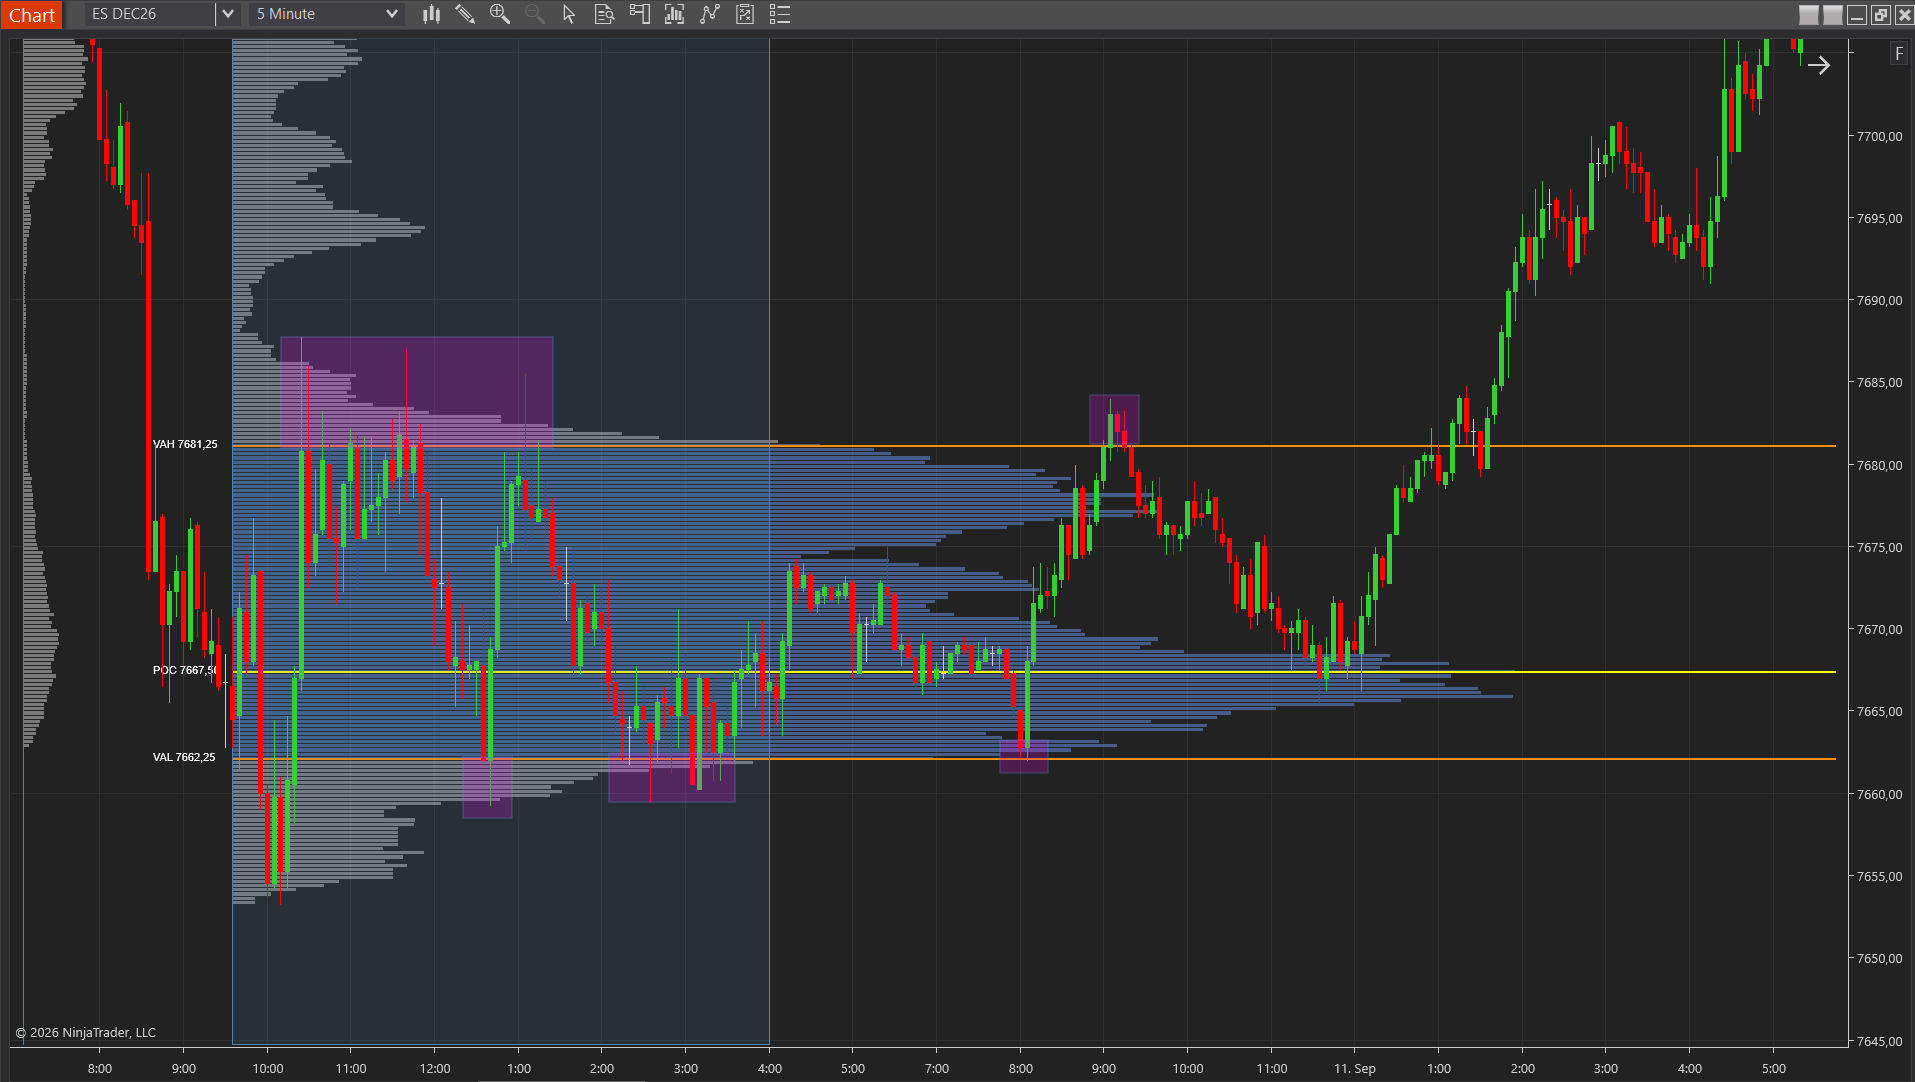
While the session is developing, price tends to gravitate back toward the POC, because that is where the most participants are willing to trade. After the session, the POC becomes a reference level: a prior-day POC frequently acts as support or resistance on the next day, and a reaction there is one of the cleanest level tests you can watch.
Value area edges as decision zones
The VAH and VAL are where accepted value ends, so they are natural places for the market to decide. When price approaches the VAH from inside, it is either going to get rejected back into value or push through and try to build value higher. Traders watch these edges for exactly that decision, and read the order flow at the level to see which way it is resolving.
One widely cited heuristic here is the 80% rule: if price opens outside the prior value area, trades back inside and holds for two 30-minute periods, it is said to have a high chance of traversing the entire value area. Treat it as a framing rather than a rule of nature. It comes from older observations on different markets, so test it on your own instrument before leaning on it.
Naked points of control
A naked (or virgin) POC is a prior session’s POC that price has not traded back through since. The market left its old fair price without revisiting it, and many traders watch those untested levels as future magnets. Kaizen Naked Levels tracks untested POCs and value-area edges across sessions and removes them automatically once price trades through, so you are not maintaining the list by hand.
Developing value vs prior value
There are always two value areas worth knowing: the one from the prior session, which is finished and fixed, and the one developing right now. Comparing them tells you whether today is accepting yesterday’s value (overlapping areas), building value higher or lower (shifted areas), or trading well outside it (an imbalanced day). The first hour is especially telling; the Initial Balance is the market’s opening attempt to define where value will be.
Anchored profiles
A session profile anchors to the open, but nothing says the anchor has to be there. Anchoring a profile to a swing high, a swing low, a news event or the start of a trend gives you the POC and value area of that specific move. Kaizen Anchored Volume Profile lets you drop the anchor anywhere and reads the profile from that point forward, which is how many traders find the fair price of a rally or a sell-off rather than of the whole day.
Kaizen Volume Profile
professionalVolume-at-price histogram with POC, Value Area & Naked Levels
$179
Lifetime license
Turning Levels into Numbers
Levels are more useful when you know how often they actually work. How frequently does price return to the prior POC? How often does a test of the VAH hold, or fail? Those are measurable questions, and the answers differ by instrument and by context.
Kaizen StatsProfile measures exactly this: it tracks touch and conditional probabilities for profile levels on your instrument and shows them live on the chart, so a level comes with a number attached instead of a hunch. It does not make a level “work”; it tells you how it has behaved historically, which is a much better starting point for a plan.
Bundle & Save
Market Profile Pack
Volume & time-at-price analysis
$349
$834
Save58%
A Realistic Word on Expectations
The POC and value area describe what the market has already agreed on. They are excellent for framing a session and for choosing where to pay attention. They do not predict what happens next. A POC that held all week can give way in a single push, a value area edge can be traversed without a pause, and the 80% rule and its cousins are tendencies, not laws. Use these levels to build context, read the order flow when price arrives at them, define your risk before you act, and remember that a level’s past behavior does not guarantee its future behavior. Everything here is educational and not financial advice; practicing on NinjaTrader’s Market Replay is the fastest way to build a feel for how profiles develop.
Frequently Asked Questions
What is the point of control in trading?
The point of control (POC) is the single price level in a profile where the most activity took place. On a volume profile it is the price with the highest traded volume; on a TPO (market profile) chart it is the price with the most time-price opportunities. Traders treat it as the fairest price of the session, the level the market accepted most, and a common magnet and support or resistance level.
What is the value area?
The value area is the price range around the point of control that contains roughly 70% of the session’s volume (or TPOs). Its upper edge is the value area high (VAH) and its lower edge the value area low (VAL). It marks where the market spent most of its time doing business, which is why traders read it as the zone of accepted value.
How is the value area calculated?
Start at the point of control and add the neighboring price levels outward, always taking the side with more volume next, until the included levels hold about 70% of the profile’s total volume. The highest included price becomes the value area high and the lowest the value area low. The 70% figure is a convention that roughly matches one standard deviation of a normal distribution.
What is the difference between a volume profile POC and a TPO POC?
A volume profile POC is the price with the most traded contracts. A TPO POC is the price that was visited in the most 30-minute periods, so it measures time rather than volume. On a normal day the two sit close together; on fast, one-directional days they can differ, because a price can be visited briefly on heavy volume or often on light volume.
What is a naked point of control?
A naked, or virgin, point of control is a prior session’s POC that price has not traded back through since that session. Because the market has not revisited its old fair price, many traders watch naked POCs as future magnets and reaction levels. Once price trades through it, it is no longer naked.
Is the 80% rule reliable?
The 80% rule is a widely cited market-profile heuristic: if price opens outside the prior value area and then trades back inside and holds there for two 30-minute periods, it is said to have a high chance of traversing the whole value area. It is a useful framing, not a guarantee. It comes from older observations on different markets, so test it on your own instrument and data before relying on it.
Want the point of control and value area on your charts? Kaizen Volume Profile, Kaizen Anchored Volume Profile and Kaizen TPO build session and anchored profiles with the POC and value area marked, and Kaizen StatsProfile adds the touch probabilities. They are all part of the Market Profile Pack. Compare everything on the pricing page.