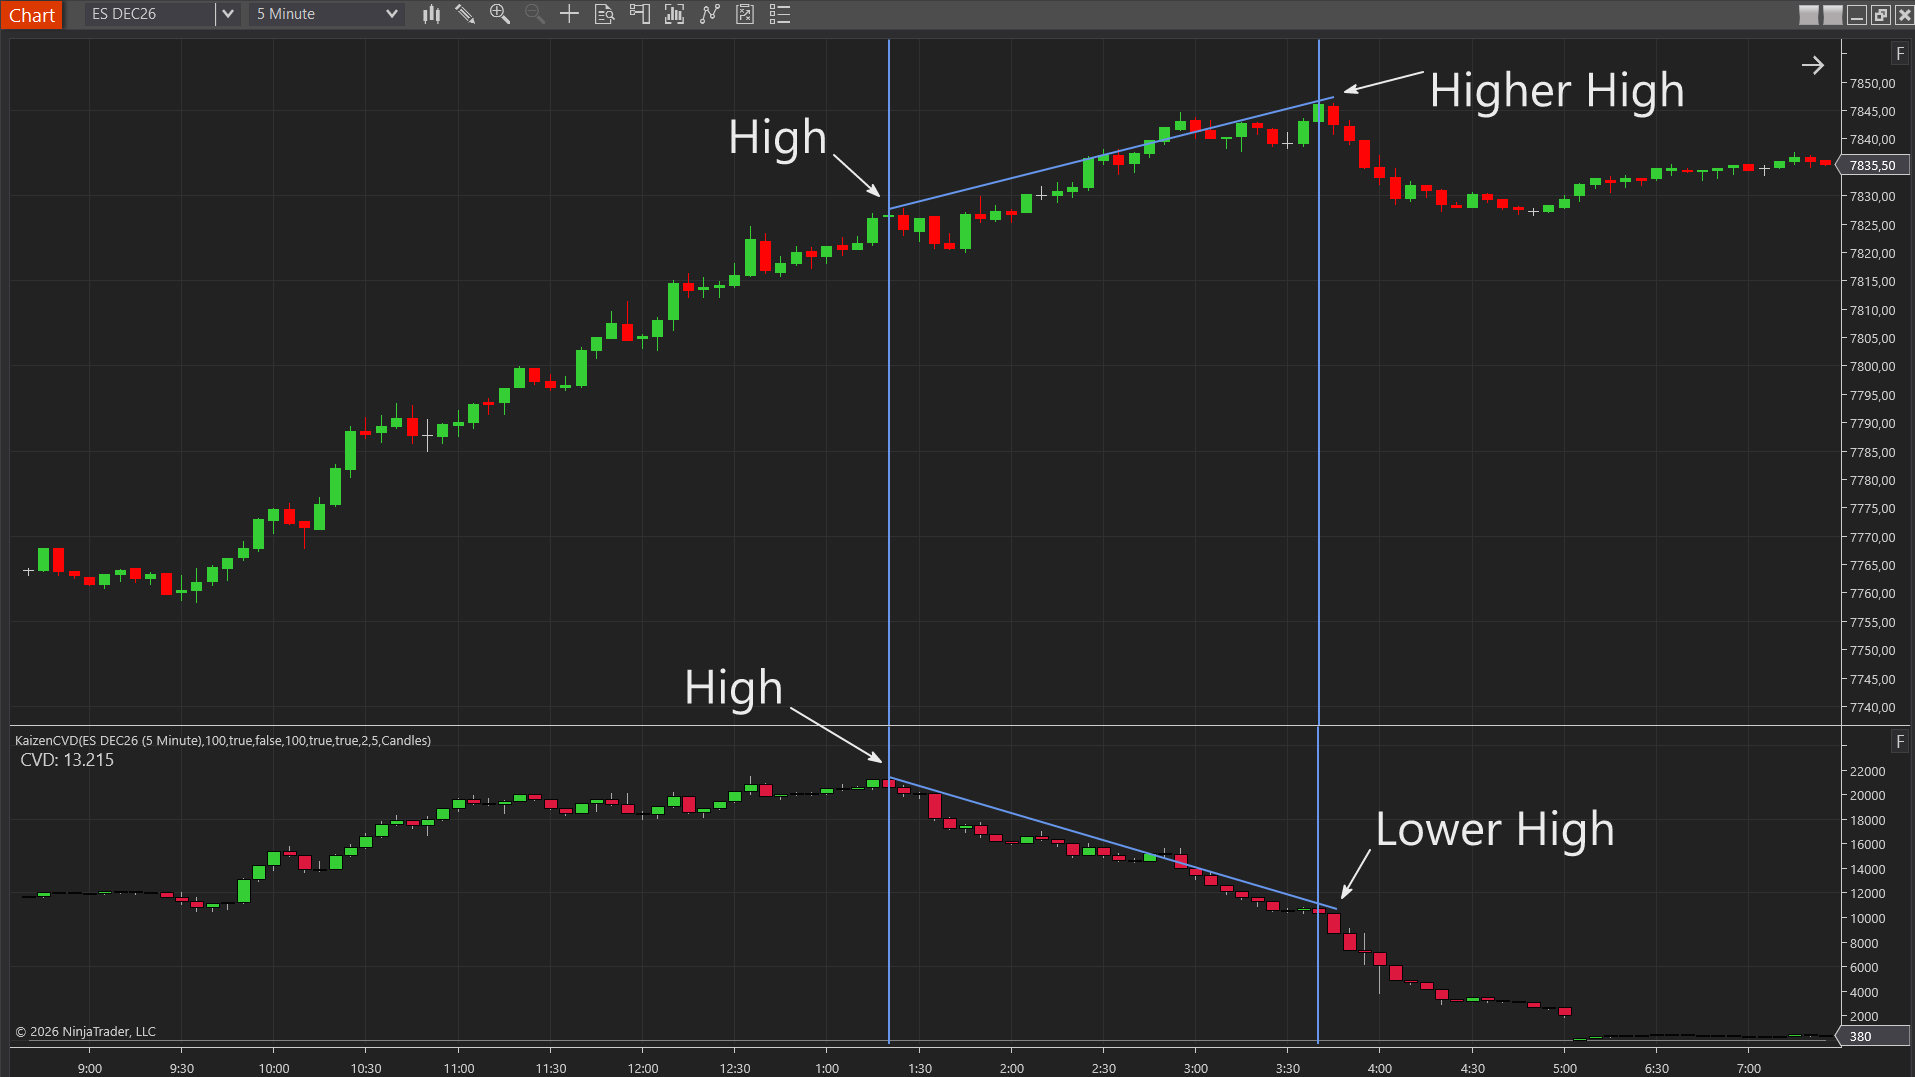
Delta divergence is when price and cumulative delta disagree: price makes a new high, but the running total of aggressive buying does not. It is one of the most watched order flow patterns because it exposes a move that looks strong on the candles but is not backed by fresh commitment. It is also one of the most misused, because a divergence is a warning, not a trade. This guide explains what delta divergence is, why it happens, how to read it in context, and the mistakes that turn a good warning into a bad trade.
If delta itself is new to you, start with what delta is in trading. The short version: each bar’s delta is volume at the ask minus volume at the bid, and cumulative delta (CVD) adds those up across the session to show which side is winning the auction over time.
What Delta Divergence Is
Divergence is simply a disagreement between two lines that usually move together. In a healthy move, price and cumulative delta rise together: new highs in price are matched by new highs in CVD, because aggressive buyers are driving both. Divergence is the moment that agreement breaks.
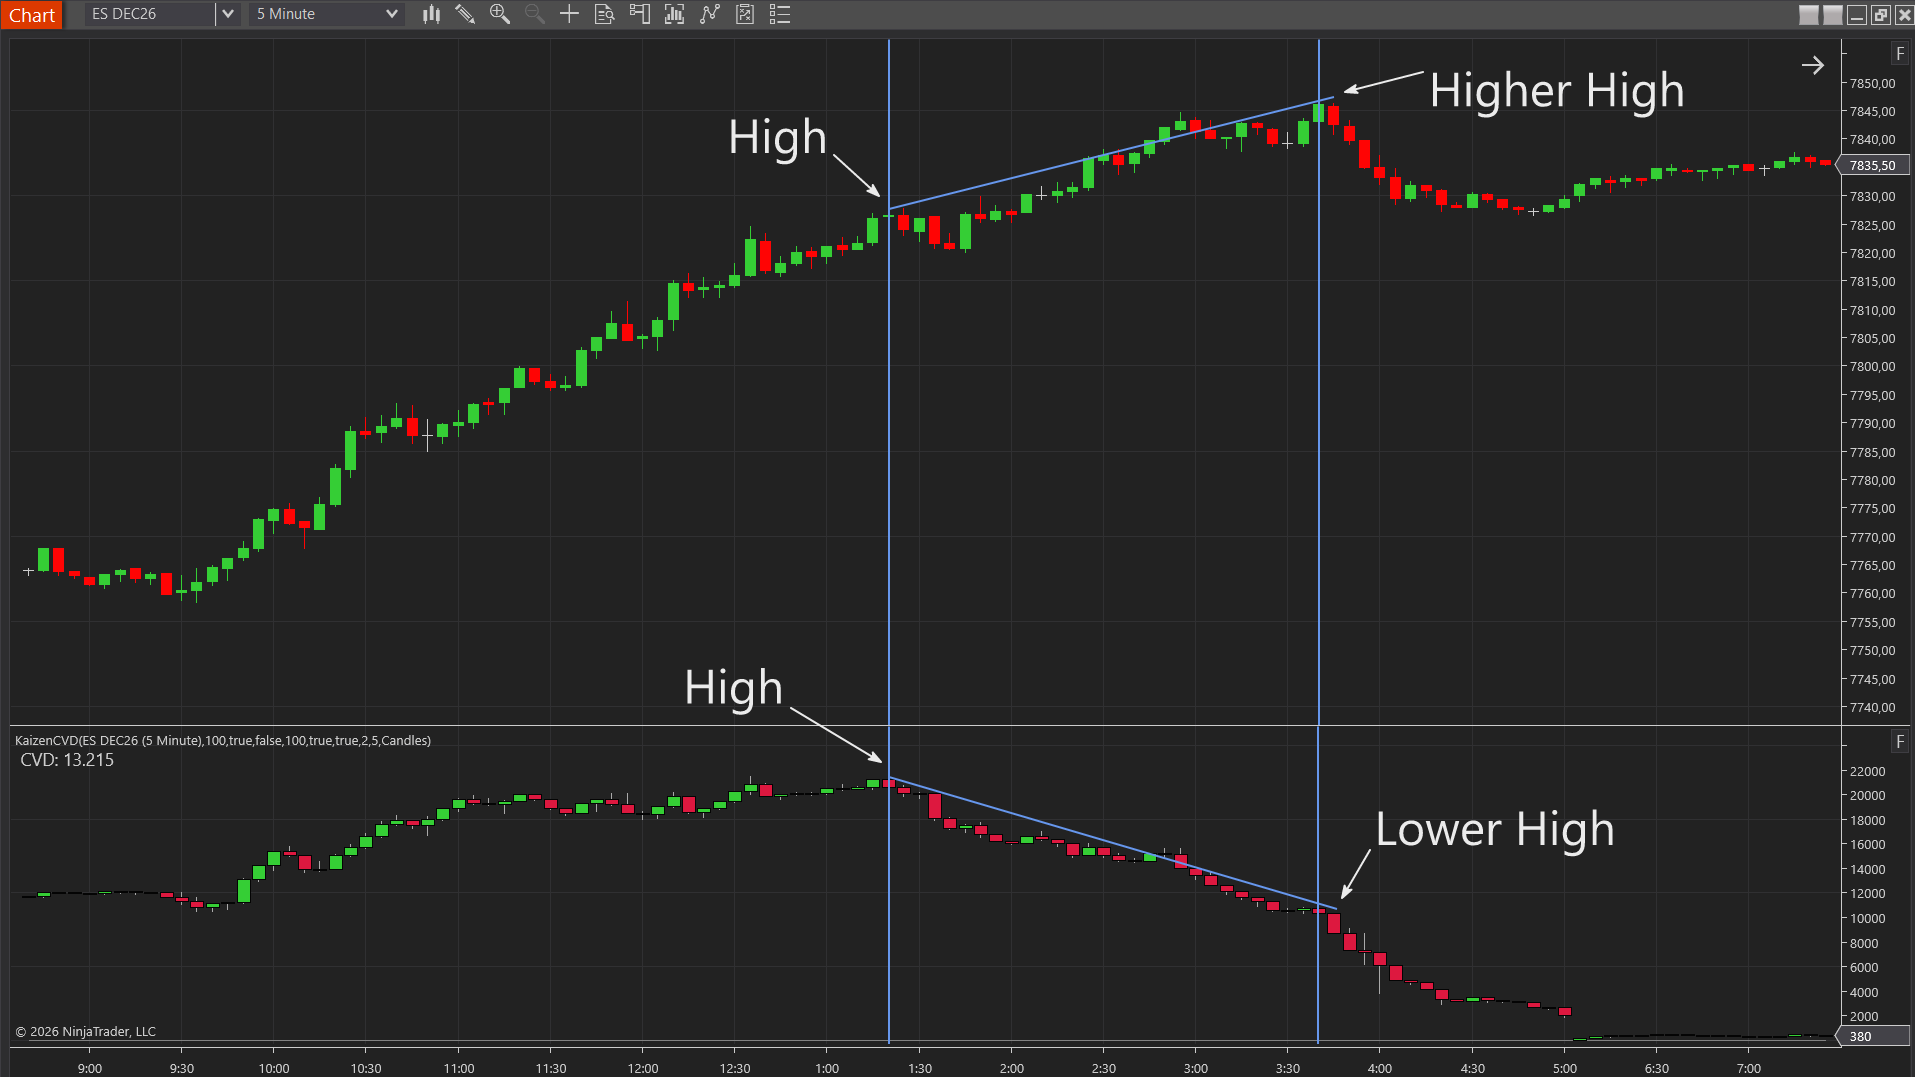
- Bearish divergence: price makes a higher high, but CVD makes a lower high. The rally is not being driven by fresh aggressive buying.
- Bullish divergence: price makes a lower low, but CVD makes a higher low. The sell-off is not being driven by fresh aggressive selling.
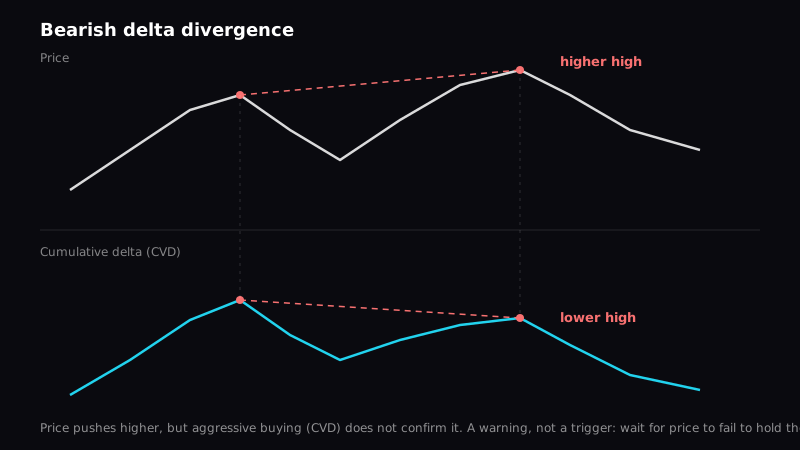
In both cases the message is the same. The side that appears to be in control is not actually committing more. Something else is moving price, and that something tends to run out.
Why It Happens
Understanding the mechanics keeps you from treating divergence as magic. There are three common reasons price can move without delta confirming it.
Absorption. A large passive participant sits with limit orders and soaks up the aggressive side. Buyers keep lifting the offer, delta keeps climbing, but price barely moves because every lift is met. On the swing that follows, aggression is visibly lower. This is the mechanism behind many divergences at levels, and it is worth its own read: see absorption in trading and how iceberg orders create it.
The other side stepped away. Price can rise simply because sellers pulled their offers, so it takes very little buying to lift it. The new high looks decisive on the candle, but the delta shows it was cheap. Stop runs and short covering do the same thing: the buying that pushes price is forced or mechanical, not conviction, and it does not build the way fresh aggression does.
Exhaustion. Sometimes the aggressive side is simply running out of participants. Each push carries less delta than the last because there are fewer buyers left to push. The divergence is the visible trace of that fading commitment.
Per-Bar Divergence vs Swing Divergence
Divergence lives on two scales, and it is useful to keep them apart.
Swing divergence is the classic CVD case above: you compare one swing high (or low) to the next, on price and on cumulative delta, over minutes or hours. Kaizen CVD plots session-anchored cumulative delta as candles or a line in a lower panel, which is the standard way to read it.
Per-bar divergence is a single candle whose delta disagrees with its direction: a red price bar that closes with strongly positive delta, for example. That means aggressive buyers pressed the whole bar and still lost, which is absorption compressed into one candle. Kaizen Delta Candle plots each bar’s delta as its own candle and flags exactly these bars, so you do not have to compare numbers by eye.
Per-bar divergence is a faster, noisier signal; swing divergence is slower and more meaningful. Many traders use per-bar flags to notice something at a level, then look to the CVD swing to decide whether it matters.
How to Read It Properly
Divergence only earns its reputation when it is read in context. These are the checks that separate a useful divergence from noise.
Location comes first
A divergence at a meaningful level carries weight: a prior high, a value area edge or point of control, the top of a range, the end of an extended move. A divergence in the middle of nowhere usually means nothing, because there is no reason for anyone to defend that price. Read how order flow behaves at a level alongside the divergence.
Compare like with like
Swing high to swing high, swing low to swing low, and within the same session. Cumulative delta resets at the open on most platforms, so a CVD high from yesterday afternoon is not comparable to one this morning. If you want a multi-session read, anchor the delta deliberately rather than mixing sessions by accident.
Look at the size of the gap
A CVD high that falls barely short of the prior one is a weak divergence; one that rolls over well below it while price pushes clearly higher is a strong one. Magnitude is not a guarantee, but it separates a hesitation from a real loss of commitment.
Wait for price to agree
This is the one that saves accounts. A divergence says the move lacks fuel; it does not say when it ends. Let price confirm: a failure to hold the new high, a close back inside the prior range, a break of the small structure that carried the push. Traders who fade every new high because CVD lagged get run over by the ones that keep going.
Respect liquidity
Thin instruments and off-hours sessions produce erratic delta, because a few prints can swing the number. Divergence is most trustworthy on liquid contracts such as ES and NQ during regular hours, where delta reflects broad participation.
Kaizen CVD
essentialCumulative Volume Delta as candles or line — read buy/sell pressure
$99
Lifetime license
Common Mistakes
- Trading the divergence itself. It is a condition, not a trigger. Without price confirmation you are guessing at the top.
- Ignoring the trend. Strong trends produce a string of bearish divergences on the way up, each of which resolves by continuing. Divergence against a strong trend needs far more confirmation than divergence at a range extreme.
- Reading mid-range divergences. With no level to defend, there is nothing for the divergence to be about.
- Over-weighting one bar. A single per-bar disagreement is a flag; a rolled-over CVD swing is a read. Do not confuse the two.
- Mixing sessions. Comparing today’s CVD to yesterday’s after a reset produces divergences that are not real.
Where the Aggression Went
Cumulative delta shows you that the aggression faded; it does not show you where it went. A delta profile does. By accumulating delta at each price rather than over time, it shows the exact levels where aggressive buyers or sellers committed most heavily, which is often the level a divergence is forming against. Kaizen Delta Profile builds this delta-at-price view and flags the levels where extreme delta lines up with repeated tests. Reading CVD divergence and the delta profile together tells you both that the push is weakening and where the fight is actually happening.
Bundle & Save
Order Flow Pro
The complete order flow toolkit
$449
$1163
Save61%
A Realistic Word on Expectations
Delta divergence gives you an honest look under the hood of a move, and that is genuinely valuable: it lets you distinguish a rally driven by commitment from one driven by an empty offer. But it is a probability shift, not a prediction. Divergences persist, resolve sideways, or get run over by the next wave of buyers more often than any single chart would suggest. Use them to raise your attention at a level, require price to confirm, define your risk before you act, and remember that a pattern that worked before does not guarantee it will work again. Everything here is educational and not financial advice; practicing on NinjaTrader’s Market Replay is the fastest way to learn how divergences actually resolve.
Frequently Asked Questions
What is delta divergence?
Delta divergence is when price and cumulative delta (CVD) move in different directions. The classic case is price making a new high while cumulative delta fails to make a new high, which means the move is not being driven by fresh aggressive buying. It is a warning that the push may be running low on fuel, not a trade signal on its own.
What is the difference between bearish and bullish delta divergence?
Bearish divergence is price making a higher high while CVD makes a lower high: buyers are pushing price up without the aggression to back it. Bullish divergence is price making a lower low while CVD makes a higher low: sellers are pushing price down without the aggression to back it. Both say the same thing in opposite directions: the visible move is not confirmed by the side that appears to be driving it.
Is delta divergence a reversal signal?
Not by itself. Divergence tells you a move lacks aggressive confirmation, which raises the odds of a stall or reversal, but markets can diverge for a long time and then continue anyway. Experienced traders treat it as a reason to pay closer attention at a level and wait for price to confirm, for example by failing to hold the new high, rather than fading a new high because CVD lagged.
Why does delta divergence happen?
Three common causes. Passive limit orders can absorb the aggressive side so price stalls despite heavy delta. A move can be carried by the other side stepping away, or by stops and short covering, rather than by fresh aggression. Or the aggressive side is simply running out of participants. In every case the visible price move is not backed by new commitment.
Which timeframe works best for delta divergence?
Divergence shows up on any timeframe, but it is most reliable when the swing being compared is meaningful for your trading horizon and when it forms at a significant level or extreme rather than mid-range. Many intraday futures traders read it on 1- to 5-minute charts against session-anchored cumulative delta. Whatever you use, compare like with like: swing high to swing high, within the same session.
Does cumulative delta reset each session?
On most platforms, yes: cumulative delta resets at the session open so it measures the current auction. That matters for divergence, because a CVD high from yesterday is not comparable to one today. Compare swings within the same session, or use an anchored cumulative delta if you deliberately want a multi-session view.
Want to see divergence as it forms? Kaizen CVD plots session-anchored cumulative delta, Kaizen Delta Candle flags the bars where delta and price disagree, and Kaizen Delta Profile shows where the aggression was actually spent. All three are part of the Order Flow Pro bundle. Compare everything on the pricing page.