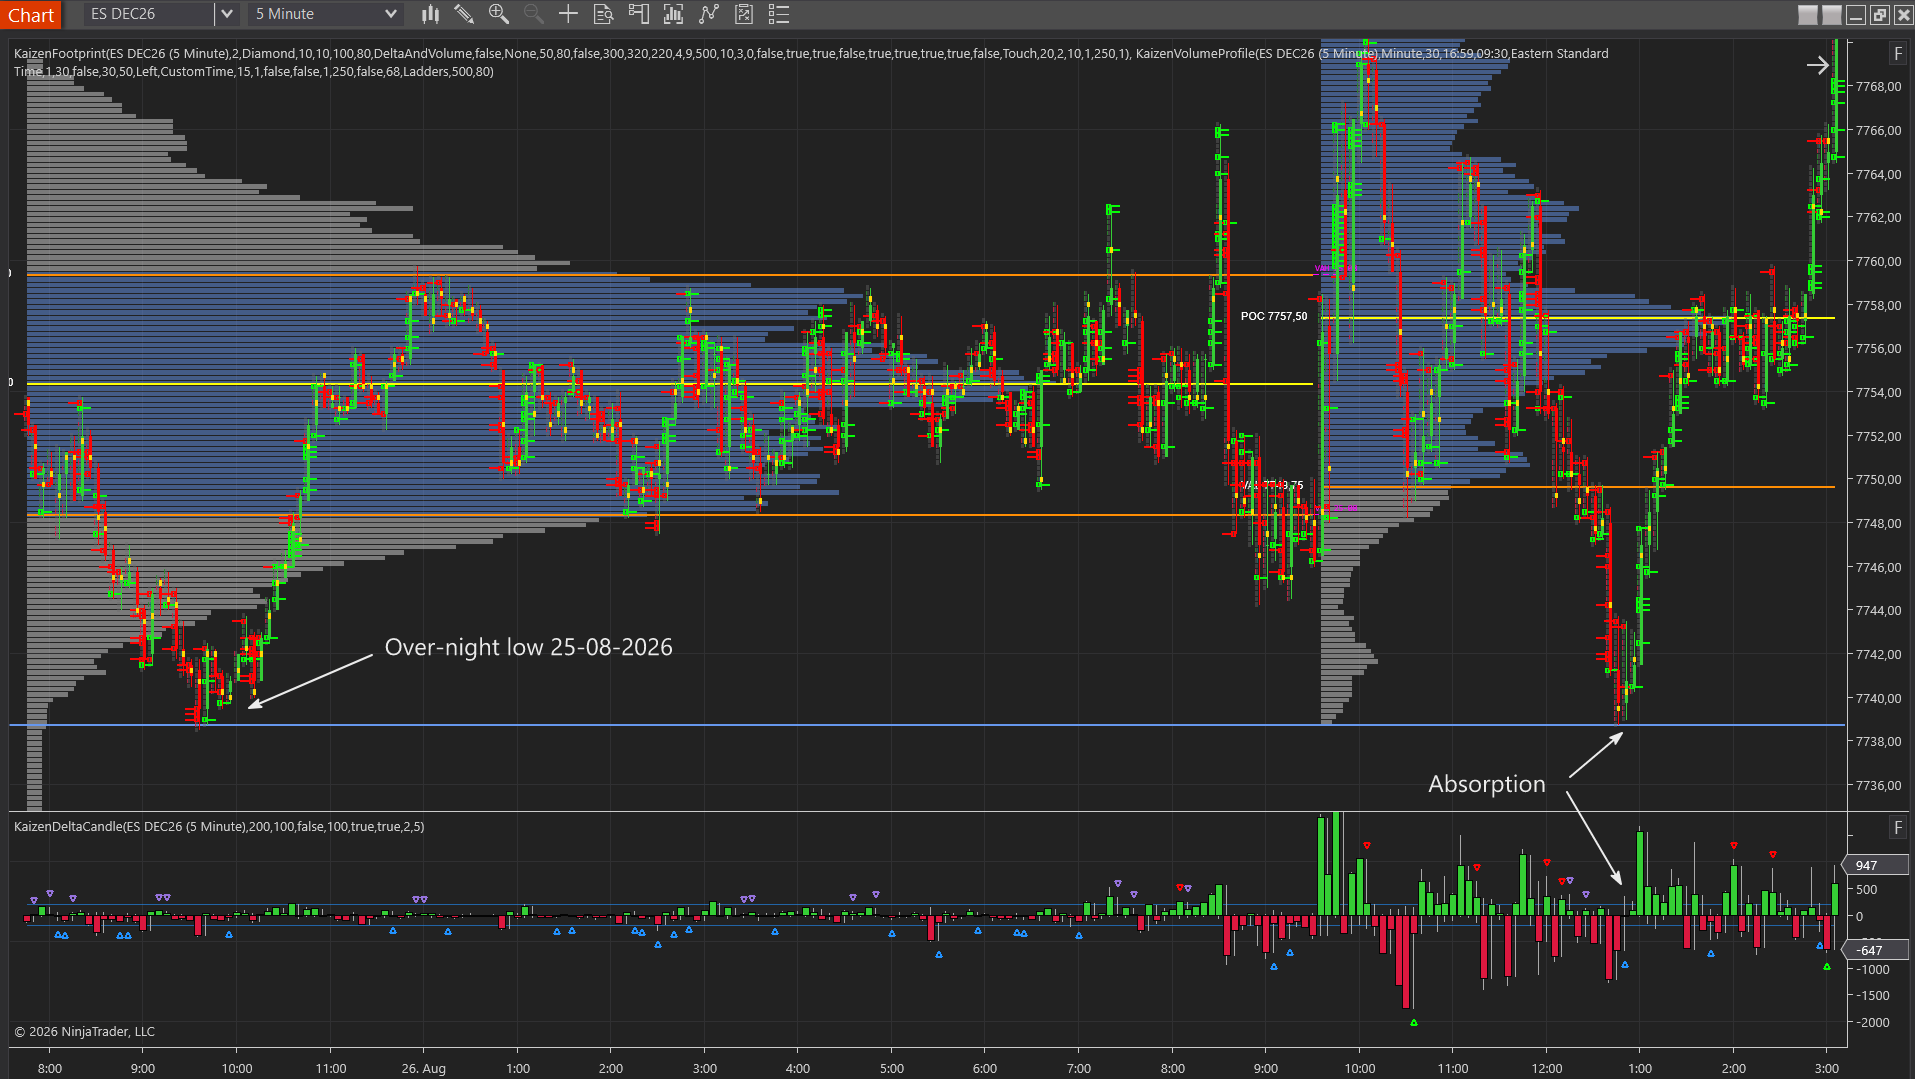
To read order flow, you watch where aggressive buyers and sellers hit the market and, just as importantly, how price responds to them. The footprint chart is where this happens in the most detail, and the reading comes down to a handful of repeatable patterns: imbalances, absorption, exhaustion and the point of control. This guide walks through each one, shows how to combine them into a reading routine, and explains how delta and market structure confirm what you see. If order flow is new to you, read our what is order flow primer first, then come back for the practical part.
Start With the Anatomy of a Footprint
A footprint chart opens each candle and shows the volume that traded at the bid and at the ask at every price level inside it. Learning to read order flow starts with recognizing three things on that footprint.
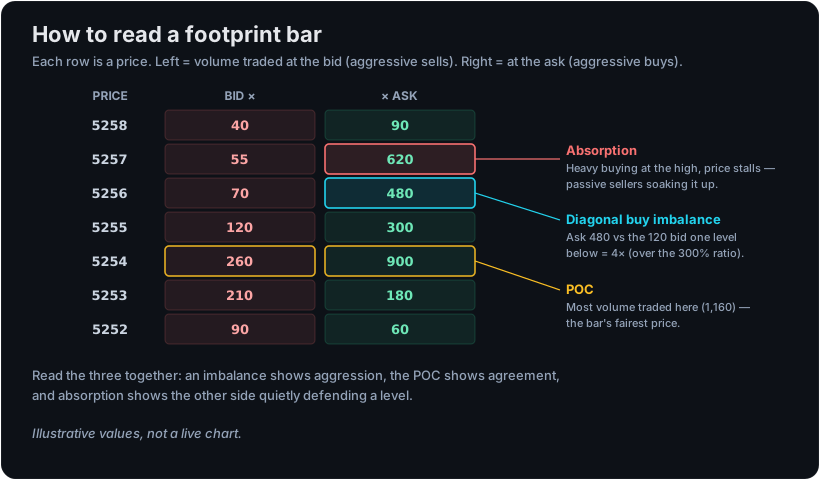
Read those three together and a single bar starts telling you a story: where one side pushed, where the market agreed on value, and where someone pushed back. Now let us take each pattern in turn.
Pattern 1: Imbalances
An imbalance is one side heavily outweighing the other at a price. On a footprint, the comparison is diagonal: the ask volume at one level against the bid volume at the level below it, because that is how the auction actually stacks. When the aggressive side is several times larger than the passive side one level away, past a ratio you set such as 300%, that price is flagged as an imbalance.
A single imbalance is minor noise. What matters is when several imbalances stack up in the same direction across consecutive price levels. A run of buy imbalances shows sustained aggressive buying through a range, and that stacked zone often becomes support on a later retest. On NinjaTrader 8, Kaizen Stacked Imbalance detects these diagonal imbalances automatically and projects the stacked zones forward as support and resistance rectangles, so you do not have to hunt for them cell by cell.
Kaizen Stacked Imbalance
professionalDiagonal bid/ask imbalances projected as support/resistance zones
$179
Lifetime license
Pattern 2: Absorption
Absorption is the mirror image of an imbalance, and it is the most important tell in order flow. It happens when heavy aggression fails to move price, because a passive participant is soaking all of it up. Aggressive buyers keep lifting the offer, the footprint shows large ask volume, and yet price will not tick higher. A large passive seller is absorbing the buying.
Absorption matters because it marks a level someone with size is willing to defend, and it frequently precedes a turn. When aggressive buyers spend all their ammunition into a wall and price still has not moved, the buyers are now trapped and the passive seller is in control. If price then starts to slip, those trapped buyers become fuel for a move the other way. The same logic runs in reverse for aggressive selling that gets absorbed by a hidden buyer.
Absorption is context, not a trigger. Walls get pulled and can break under fresh aggression. What absorption gives you is a high-interest level and a read on who is winning the fight there, which is exactly what you want before looking for a trade. Absorption is also the tell behind hidden size; see our guide to iceberg orders.
Pattern 3: Exhaustion
Exhaustion is what a move looks like when it runs out of participants. On the footprint you often see it as volume drying up at the extreme of a push: the aggressive side that drove the move can no longer find willing counterparties, the prints thin out, and the delta that was feeding the trend fades. Where absorption is aggression meeting a wall, exhaustion is aggression simply running dry.
Exhaustion at the end of an extended move, especially into a known structural level, is a classic spot for a market to reverse or at least pause. As always, it describes a condition rather than dictating an action.
Pattern 4: The Point of Control
The point of control is the price with the most volume in a bar or a profile, the level where buyers and sellers did the most business and, in that sense, agreed on value. Reading where the point of control sits and how it migrates tells you where the market keeps returning. A point of control that keeps building at the same price signals acceptance and balance; one that migrates steadily in one direction signals a trend developing. It gives you the anchor around which the imbalances, absorption and exhaustion play out. On a time-based TPO chart the point of control is the price with the most time rather than the most volume, and reading the two together is a useful cross-check.
Putting It Together: A Reading Routine
Individual patterns are only useful inside a routine. Here is a sensible order to read in, from the big picture down to the trigger.
- Set the structure before the session. Mark your volume profile levels, VWAP and prior-session highs and lows. These are the prices where order flow reactions are most likely to matter. Our volume profile versus TPO guide covers the structural side. Classic pivot levels are another quick structural reference; our free Pivots indicator draws them for you.
- Read the session bias with delta. Cumulative delta tells you which side has been pressing the auction all day. Kaizen CVD makes the trend of aggression, and any divergence from price, easy to see at a glance.
- Wait for price to reach a level that matters. You do not need to read the footprint everywhere. You need to read it where structure says a reaction is likely.
- Read the footprint at that level. Is aggression stacking into imbalances through the level, or is it being absorbed at it? Is the pushing side exhausting? This is the tick-level confirmation.
- Decide with confluence, and define risk. When structure, delta and the footprint all point the same way, your read is strongest. When they disagree, that is information too, and often a reason to stand aside.
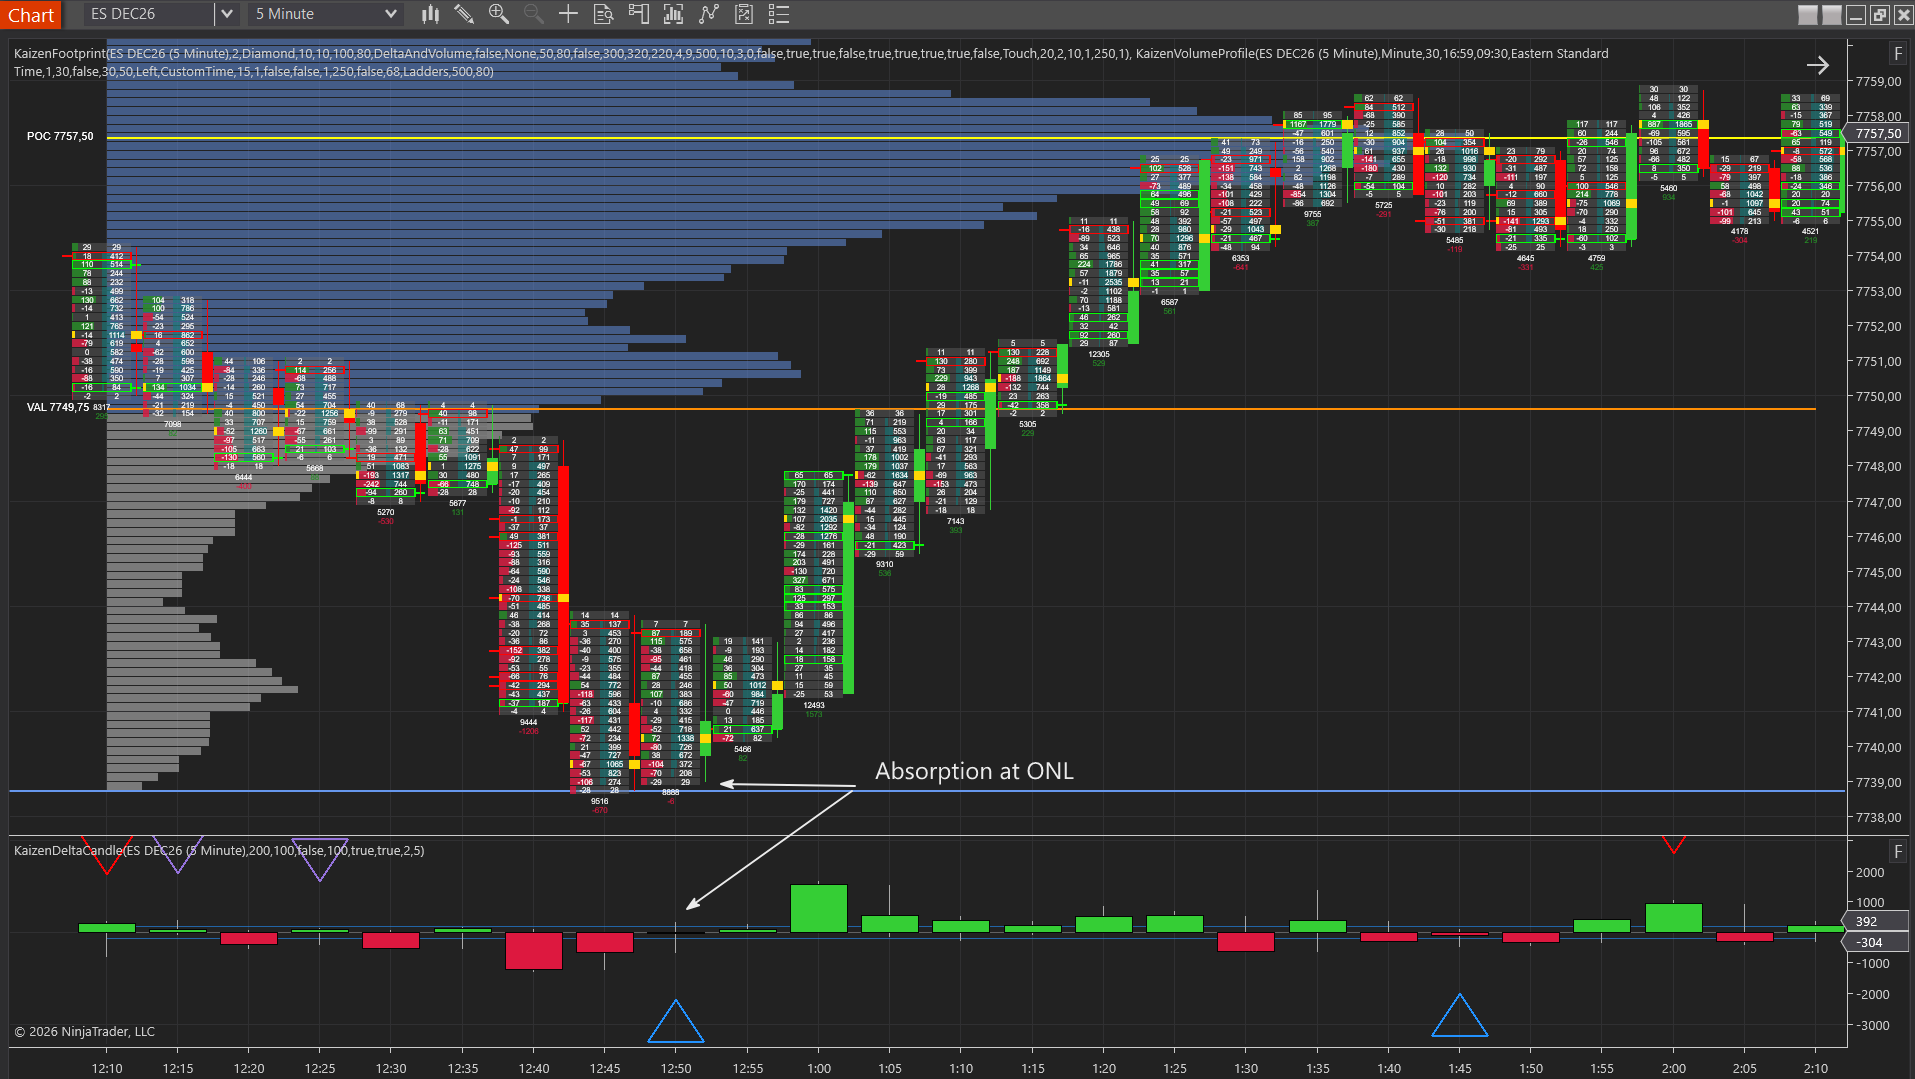
For a category-by-category tour of every tool in this stack and how to choose, see our guide to the best NinjaTrader order flow indicators. For the granular footprint mechanics, the complete footprint chart guide goes deeper on each pattern with more examples.
Bundle & Save
Order Flow Pro
The complete order flow toolkit
$449
$1163
Save61%
Common Mistakes When Learning to Read Order Flow
A few traps catch almost everyone at the start:
- Reading every cell. The footprint is dense, and trying to interpret every bar everywhere leads to paralysis. Read it only where structure says it matters.
- Treating a single imbalance as a signal. One imbalance is noise. Stacked imbalances, absorption and exhaustion at a meaningful level are what carry weight.
- Ignoring the data. If your footprint loads blank or your delta looks wrong, it is almost always the data feed, not the pattern. See our data feeds guide.
- Skipping screen time. Order flow is pattern recognition. It only becomes intuitive after hours of watching it, which is what Market Replay is for.
A Realistic Word on Expectations
Reading order flow is interpretation, and interpretation can be wrong. Imbalances fail, absorption breaks, exhaustion turns out to be a pause before continuation. What order flow buys you is a much higher-resolution view of what buyers and sellers are actually doing, which can genuinely sharpen your timing and your understanding of a level. It does not predict the future and it does not remove risk. Everything here is educational, not financial advice; the examples are illustrative, not recommendations. Trade your own plan, define your risk before you enter, practice on a simulator first, and remember that past behavior does not guarantee future results.
Frequently Asked Questions
How do you read order flow?
You read order flow by watching where aggressive buying and selling hit the market and how price responds. On a footprint chart you look for imbalances (one side heavily outweighing the other at a price), absorption (heavy aggression that fails to move price), exhaustion, and the point of control. Delta and market structure then confirm or question what the footprint shows.
What should a beginner look at first in order flow?
Start with cumulative delta and the point of control, which give you the session’s overall buy/sell bias and its fairest price without overwhelming detail. Once those feel natural, add the footprint chart to read imbalances and absorption at specific levels. Trying to read every footprint cell on day one is the fastest way to get lost.
What is the difference between an imbalance and absorption?
An imbalance is one side clearly outweighing the other at a price, which shows aggression in a direction. Absorption is heavy aggression that fails to move price because a passive participant is soaking it up. Imbalance says a side is pushing; absorption says the other side is quietly defending. Reading them together is the core skill.
Do I need a footprint chart to read order flow?
A footprint chart gives you the most granular view, but it is not the only way in. Cumulative delta, large-trade detection and volume profile all read order flow at a higher level and are easier for beginners. Many traders use delta and structure for the bias and add the footprint only at the levels that matter.
How long does it take to learn to read order flow?
It varies, but reading order flow is pattern recognition that only comes with screen time. Most traders need weeks to months of watching it, ideally on a simulator or market replay, before the patterns become intuitive. There is no shortcut, and no amount of reading replaces watching the tape yourself.
Related reading
- What is order flow trading? — the primer, if any of the terms above are new
- What is delta in trading? — the confirmation layer in step 2
- Iceberg orders explained — absorption as the footprint of hidden size
- What is a TPO chart? — the time-based point of control
- The complete footprint chart guide and best NinjaTrader order flow indicators
- Free Pivots indicator for quick structural levels
Want the full stack for reading order flow on NinjaTrader 8? The Order Flow Pro bundle brings the footprint, cumulative delta, stacked imbalance detection and more into one workspace. Compare everything on the pricing page.