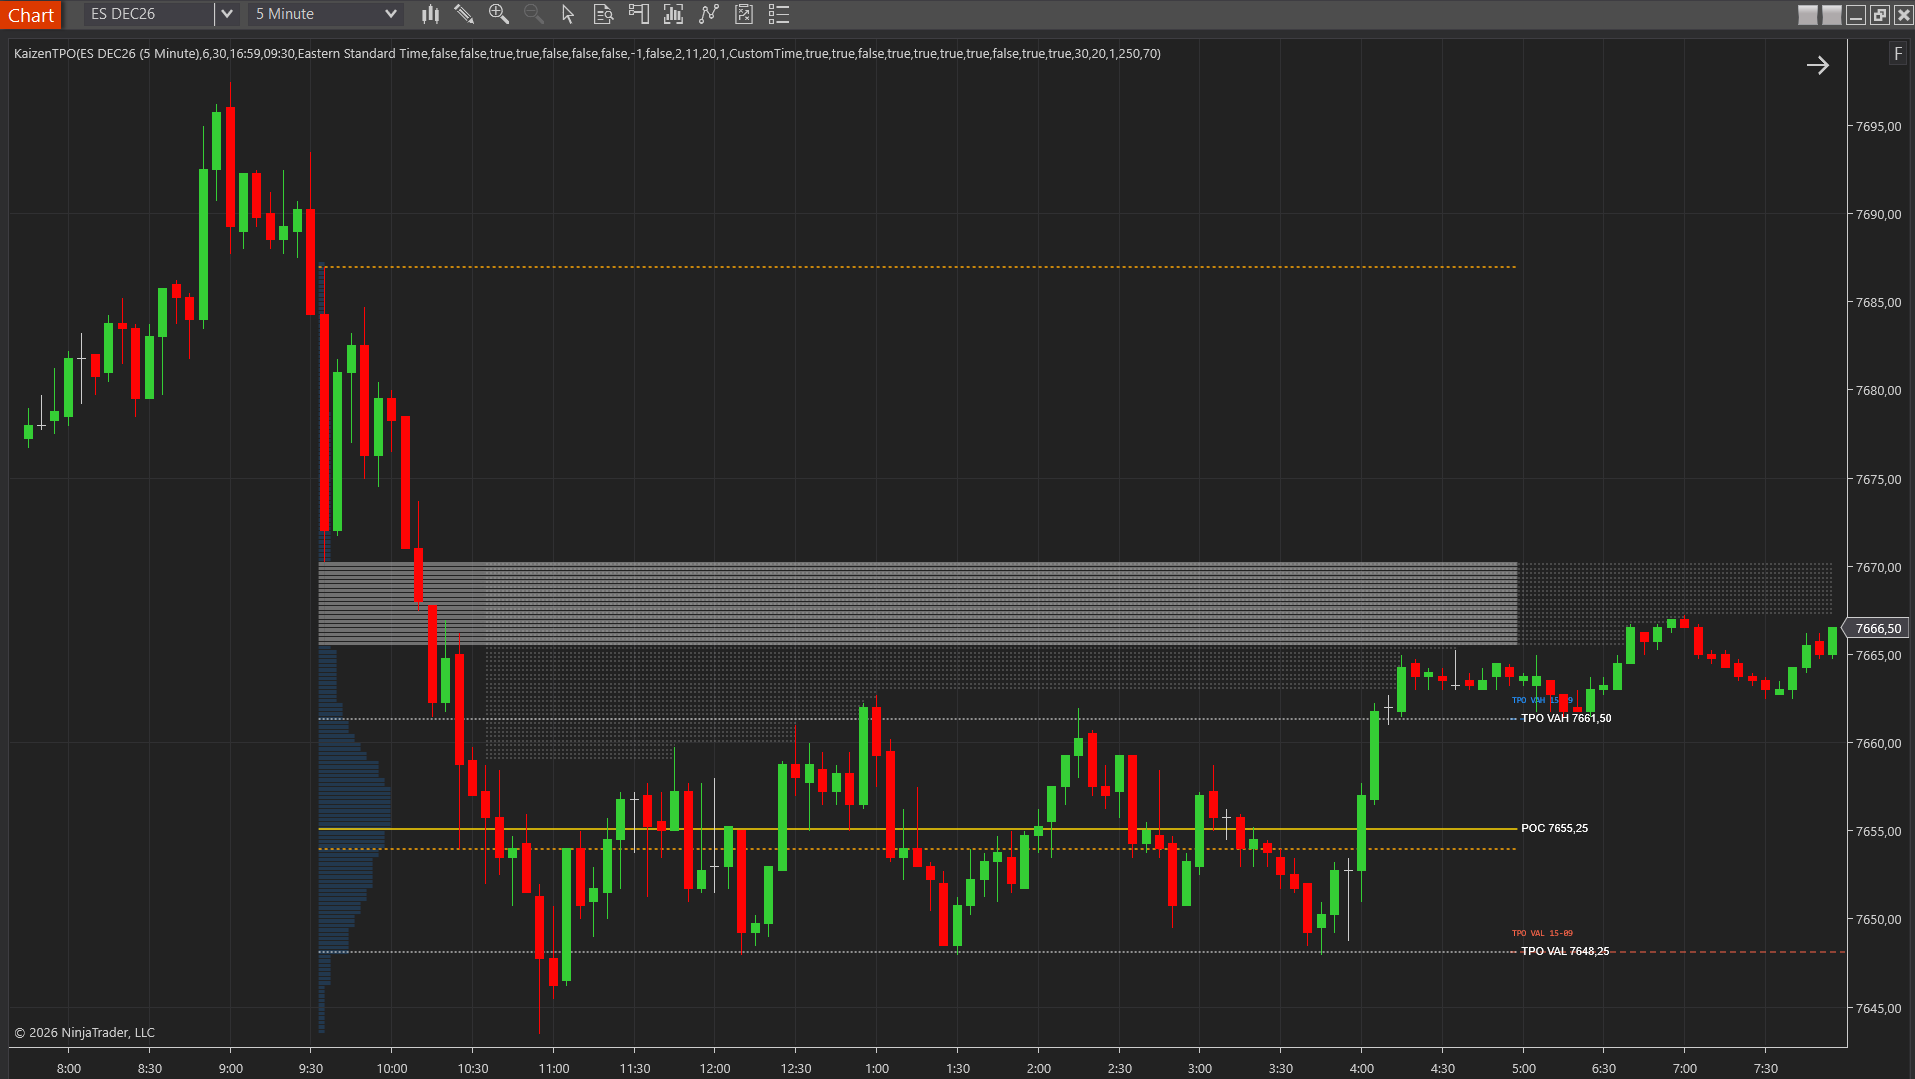
A TPO chart, short for Time Price Opportunity, is a market profile that shows how much time the market spent at each price during a session. Every sub-period, usually 30 minutes, adds a letter at each price the market traded, and those stacked letters build a profile that reveals where the market found fair value and where it did not. TPO is one half of the market profile toolkit; volume profile is the other. This guide explains what a TPO chart is, how it is built, and how to read its three key features.
What Is a TPO Chart, Exactly?
TPO stands for Time Price Opportunity. The concept was developed by J. Peter Steidlmayer at the Chicago Board of Trade in the 1980s as a way to organize a trading session by price rather than by time. Where a candlestick chart plots price against the clock from left to right, a TPO chart collapses the whole session onto the price axis and asks a single question at each level: how much time did the market spend here?
The answer to that question matters because of auction theory. If a price is fair, buyers and sellers both transact there and the market lingers. If a price is unfair, too high for buyers or too low for sellers, the market leaves quickly. By counting time at each price, a TPO chart shows you which prices the market accepted and which it rejected, which is the foundation of reading market structure.
How a TPO Chart Is Built
The mechanics are simple once you see them. The session is divided into sub-periods, traditionally 30 minutes each, and each sub-period is assigned a letter: A for the first 30 minutes, B for the next, and so on. For every price the market touches during a sub-period, one letter is placed at that price level.
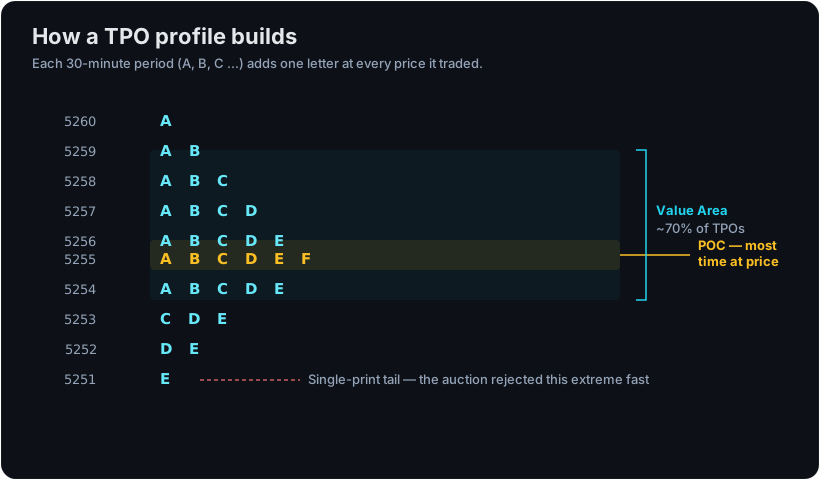
As the day progresses, prices the market keeps returning to accumulate many letters and stick out as the widest part of the profile. Prices the market only brushed once stay thin. By the close, the profile has taken shape, and three features stand out.
- Point of Control (POC). The price with the most letters, meaning the market spent more time here than anywhere else. This is the session’s fairest price by the time-based measure, and it often acts as a magnet on the following session.
- Value Area. The range of prices containing roughly 70% of all the letters, bracketing the POC. Prices inside the value area were accepted; prices outside were being explored. The value area high and value area low are watched closely as the edges of fair value.
- Single prints and tails. A single print is an interior price the market visited during only one sub-period. Because it was passed through quickly and never revisited, auction theory calls it unfinished business, and price often returns to it later. A single print at the very top or bottom of the profile is called a tail, and it signals that the market rejected that extreme aggressively.
Reading a TPO Chart on NinjaTrader 8
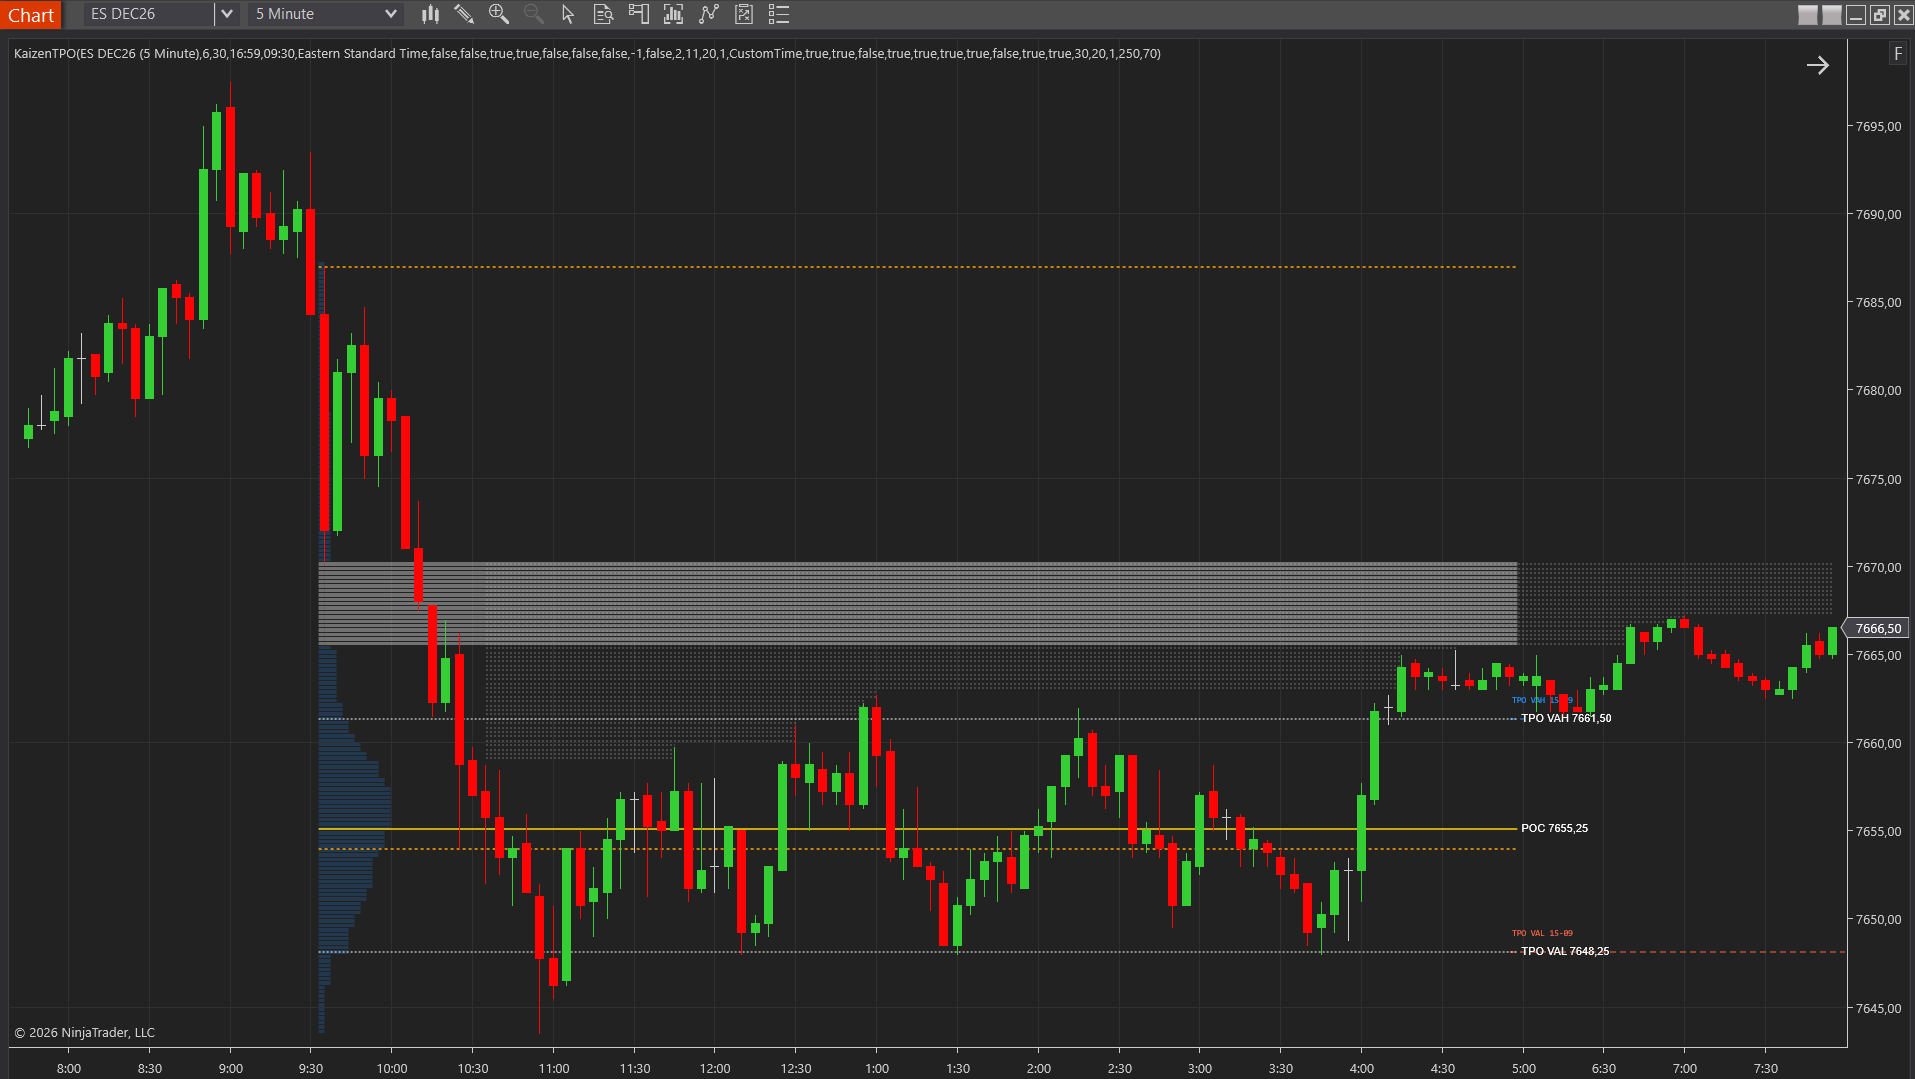
On NinjaTrader 8, Kaizen TPO renders the classic market profile directly on your chart with session, daily and weekly modes. It calculates the POC and value area for you, detects single prints, and projects them forward as dashed lines until price finally retests them, so you always know where the unfinished business sits. Setup and every option are covered in the TPO documentation.
Day types you can read from the shape
The shape of a TPO profile gives you a fast read on what kind of day is unfolding:
- A balanced, bell-shaped profile with a central POC signals a rotational day. The market kept returning to the middle, and mean-reversion around the value area edges tends to fit.
- A thin, elongated profile signals a trend day. The market spent little time at each level and kept moving, so the correct response is usually to join the trend on pullbacks rather than fade the extremes.
- A double distribution, two separate clusters of letters with a thin band of single prints between them, tells you the market valued two different zones during the session, often ahead of a resolution the next day.
The first hour of the profile, the initial balance, and the session boundaries themselves are worth marking too. Our free Sessions indicator draws session shading, the opening range and the initial balance on any NinjaTrader 8 chart, which pairs naturally with a TPO profile.
Kaizen TPO
professionalMarket Profile with time-based price distribution & single print detection
$179
Lifetime license
TPO vs Volume Profile
The most common question about TPO is how it differs from volume profile, because the two look almost identical at a glance. The difference is what they count. A TPO chart counts time; a volume profile counts contracts. A price can have a high TPO count because the market lingered there for hours on light volume, or a high volume count because a single burst of heavy trading hit it briefly. Most of the time they agree, and when they disagree it is worth paying attention.
Neither is better in the abstract; they answer different questions. Many traders run both, using volume profile to find where real business was done and TPO to read the auction’s time structure. We break the two down side by side, with when to use each, in our guide to volume profile versus TPO market profile. For the wider context of how profiles fit alongside the order flow tools such as footprint and delta, see our overview of the best NinjaTrader order flow indicators.
A Note on Using TPO Sensibly
A TPO chart is a description of an auction that has already happened. It tells you where the market found value and where it left unfinished business, which is genuinely useful for framing the next session. It does not predict what the market will do. A single print can stay untested for days, and a POC that acted as support can give way when conditions change. Use TPO to build context, combine it with your own plan and risk management, and remember that past auction behavior does not guarantee future results.
Frequently Asked Questions
What is a TPO chart?
A TPO chart, short for Time Price Opportunity, is a market profile that shows how much time the market spent at each price level during a session. Each sub-period, usually 30 minutes, adds a letter at every price it traded. The stacked letters form a profile that reveals the point of control, value area and single prints.
What does TPO stand for?
TPO stands for Time Price Opportunity. Each letter block on the profile represents one opportunity, during one sub-period, to trade at that price. Counting those blocks per price level measures how much time the market spent there.
What is the difference between a TPO chart and a volume profile?
A TPO chart measures time at each price, while a volume profile measures contracts traded at each price. They often look similar but answer different questions. Volume profile shows where the most business was done; TPO shows where the market spent the most time, which is useful for reading the day’s auction structure.
What are single prints on a TPO chart?
Single prints are interior price levels the market visited during only one sub-period. Because the market moved through them quickly and never returned, auction theory treats them as unfinished business, and they often become retest targets later. Single prints at the extreme of a profile are called tails and signal rejection.
What sub-period should I use for a TPO chart?
The traditional market profile convention is 30-minute sub-periods, which is a sensible default for index futures. Some traders use 15 or 60 minutes depending on the instrument and their timeframe. Shorter sub-periods add detail but also noise, so 30 minutes remains the standard starting point.
Related reading
- Volume profile vs TPO market profile — the two profiles side by side, and when to use each
- What is order flow trading? — the tick-level activity that plays out against the profile
- Kaizen TPO, its documentation, and Kaizen Volume Profile
- Free Sessions indicator — session shading, opening range and initial balance for NinjaTrader 8
Want to run market profile on your own charts? Kaizen TPO brings session, daily and weekly profiles with single-print detection to NinjaTrader 8, and it pairs naturally with volume profile and VWAP in the Market Profile Pack. Compare everything on the pricing page.
Bundle & Save
Market Profile Pack
Volume & time-at-price analysis
$349
$834
Save58%