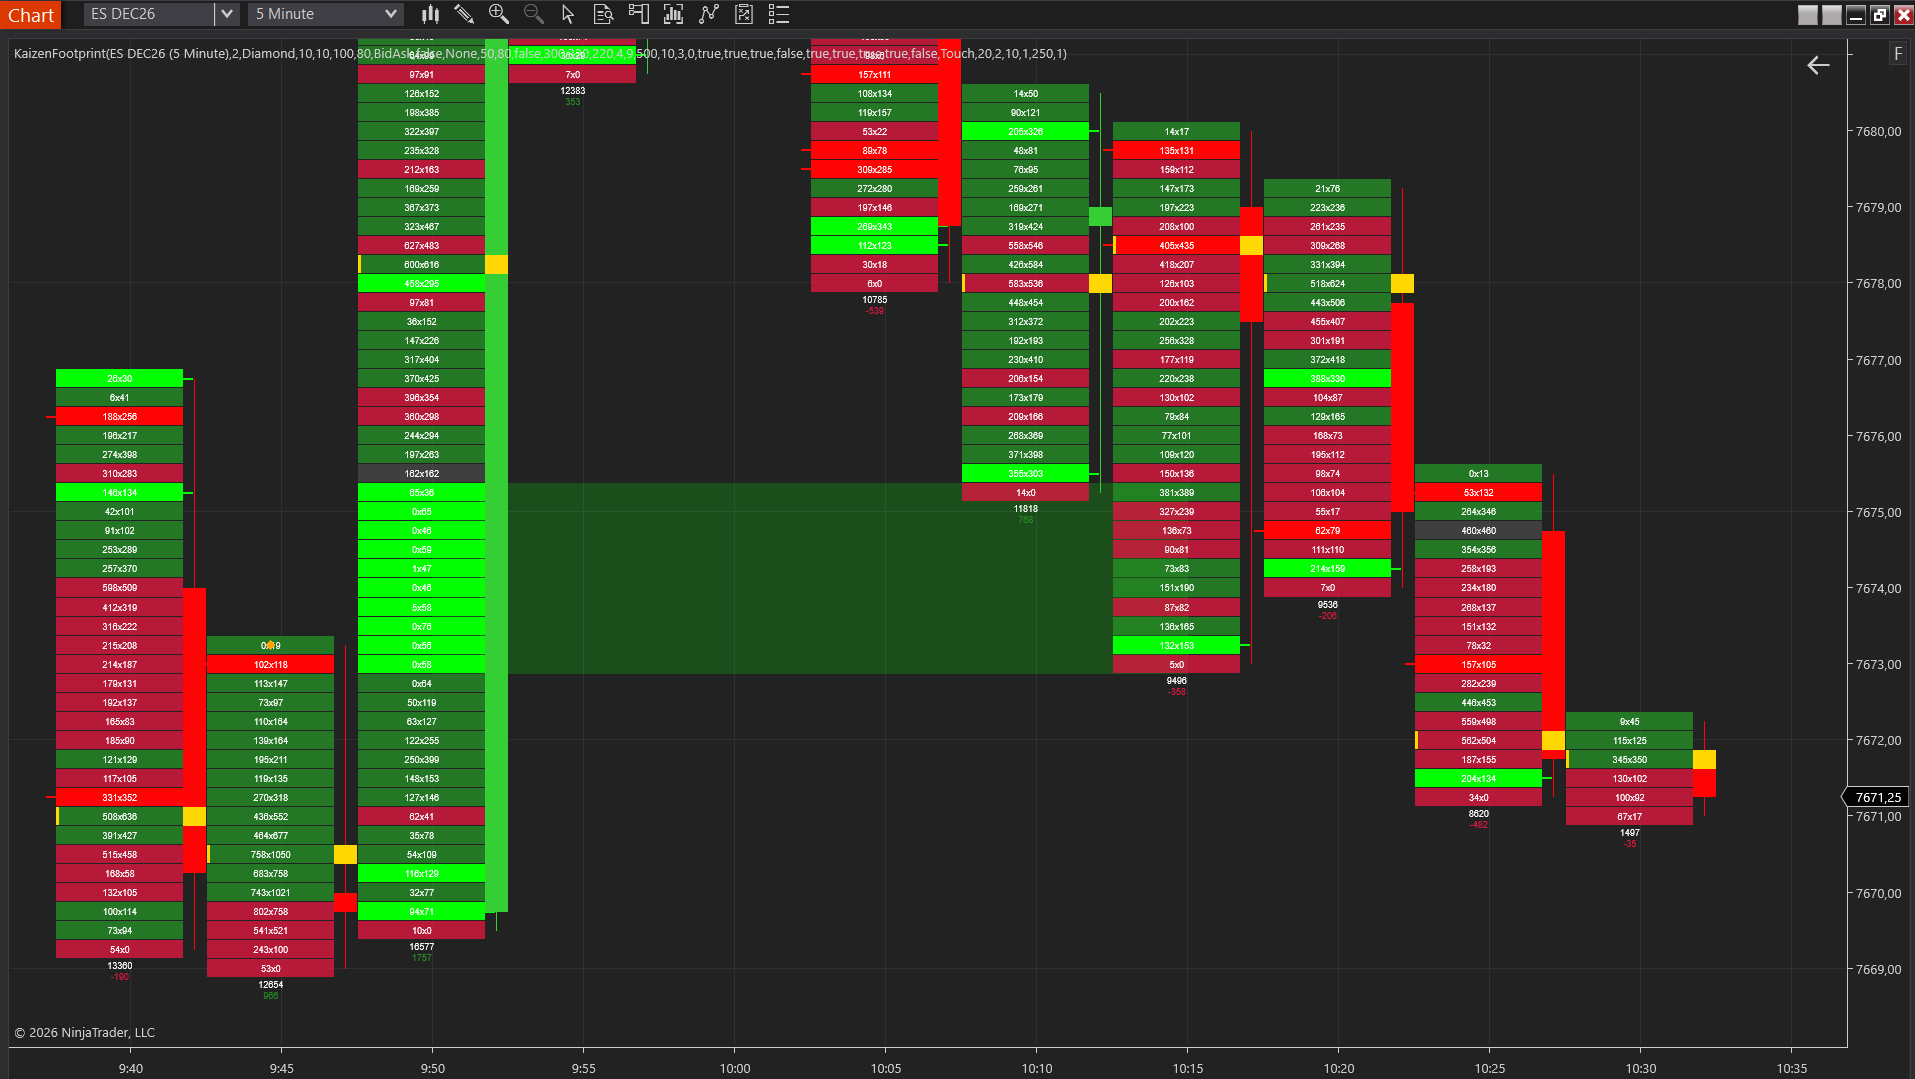
Order flow trading is the practice of reading the raw buying and selling activity in a market, trade by trade, to judge the real balance of supply and demand. Instead of relying only on price and lagging indicators, an order flow trader watches who is transacting aggressively at the bid versus the ask, how much size is changing hands at each price, and where large participants are committing. This guide explains what order flow is, how it is generated by the market’s auction, the tools that make it readable, and how a beginner can start on NinjaTrader 8.
What Is Order Flow?
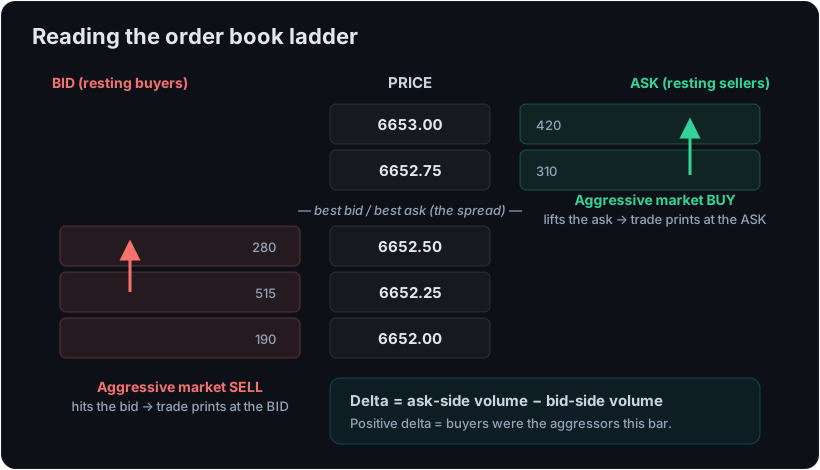
Every market is a continuous auction. At any instant there are resting buy orders (bids) and resting sell orders (offers, or asks) sitting in the order book. Nothing happens until someone crosses the spread with a market order. When a buyer is impatient and lifts the offer, a trade prints at the ask. When a seller is impatient and hits the bid, a trade prints at the bid. That stream of aggressive executions, price by price and size by size, is order flow.
Reading price alone tells you the outcome of the auction. Reading order flow tells you the mechanics behind it: whether the move up happened on genuine aggressive buying or simply because sellers stepped away, whether a level held because real size defended it or because nobody tested it hard. Two candles that look identical can have completely different order flow underneath, and that difference is often what separates a continuation from a reversal.
Aggressive vs passive
The single most important idea in order flow is the split between aggressive and passive participants.
- Aggressive orders are market orders that cross the spread to get filled immediately. They are the impatient side. A market buy is aggressive; it pays the ask to get in now.
- Passive orders are limit orders resting in the book, waiting to be filled. They are the patient side. A limit sell sitting at the offer is passive; it gets filled when an aggressive buyer comes to it.
When you hear traders talk about “buyers in control”, they usually mean aggressive buyers are lifting offers faster than aggressive sellers are hitting bids. The core metric that captures this is delta.
Delta: The Heartbeat of Order Flow
Delta is the difference between volume that traded at the ask and volume that traded at the bid over a given period. Positive delta means aggressive buyers dominated; negative delta means aggressive sellers dominated. It is the most direct numerical read on who was pressing the market.
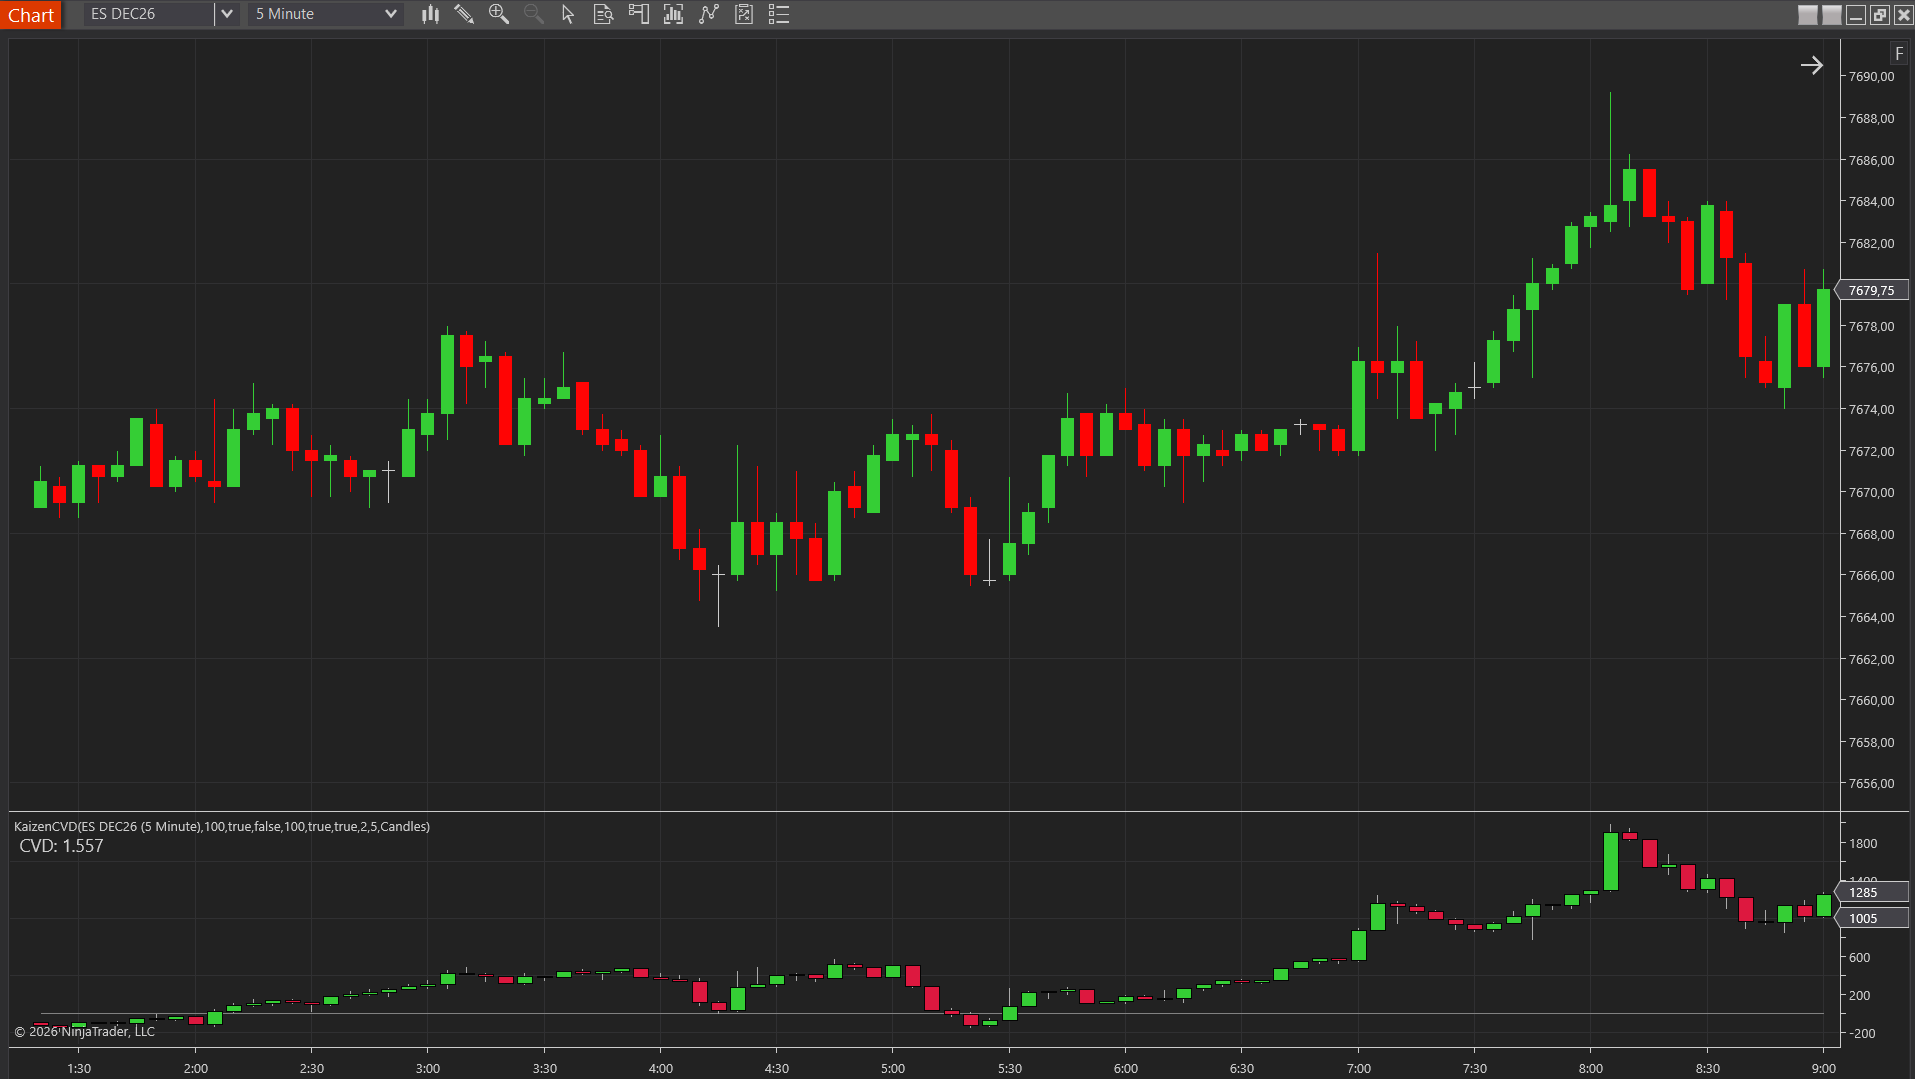
Delta on its own is useful, but its real power shows up in two forms. Per-bar delta shows the aggression inside a single candle, and cumulative delta (CVD) keeps a running session total so you can see the trend of aggression build over hours. We cover this in depth in our guide to what delta is in trading, but the short version is: delta is how you quantify the aggressive side of the auction.
A classic thing to watch for is divergence. If price grinds to a new high but cumulative delta fails to make a new high with it, aggressive buying is not confirming the move. That does not guarantee a reversal, but it is a warning that the push higher is running on thinner fuel than the price chart suggests.
Kaizen CVD
essentialCumulative Volume Delta as candles or line — read buy/sell pressure
$99
Lifetime license
The Tools That Make Order Flow Readable
Raw order flow is a firehose. Thousands of trades print every minute in an active future like the ES (the S&P 500 E-mini) or NQ (the Nasdaq 100 E-mini). You cannot read that stream tick by tick with your eyes, so order flow tools aggregate and visualize it. Here are the main ones.
The footprint chart
A footprint chart opens up each candle and shows the bid and ask volume transacted at every single price level inside it. Where a normal candle gives you four numbers (open, high, low, close), a footprint shows you the internal battle: exactly how much traded at the bid and the ask at each tick. It is the most granular order flow view available to retail traders. Kaizen Footprint is our implementation for NinjaTrader 8.
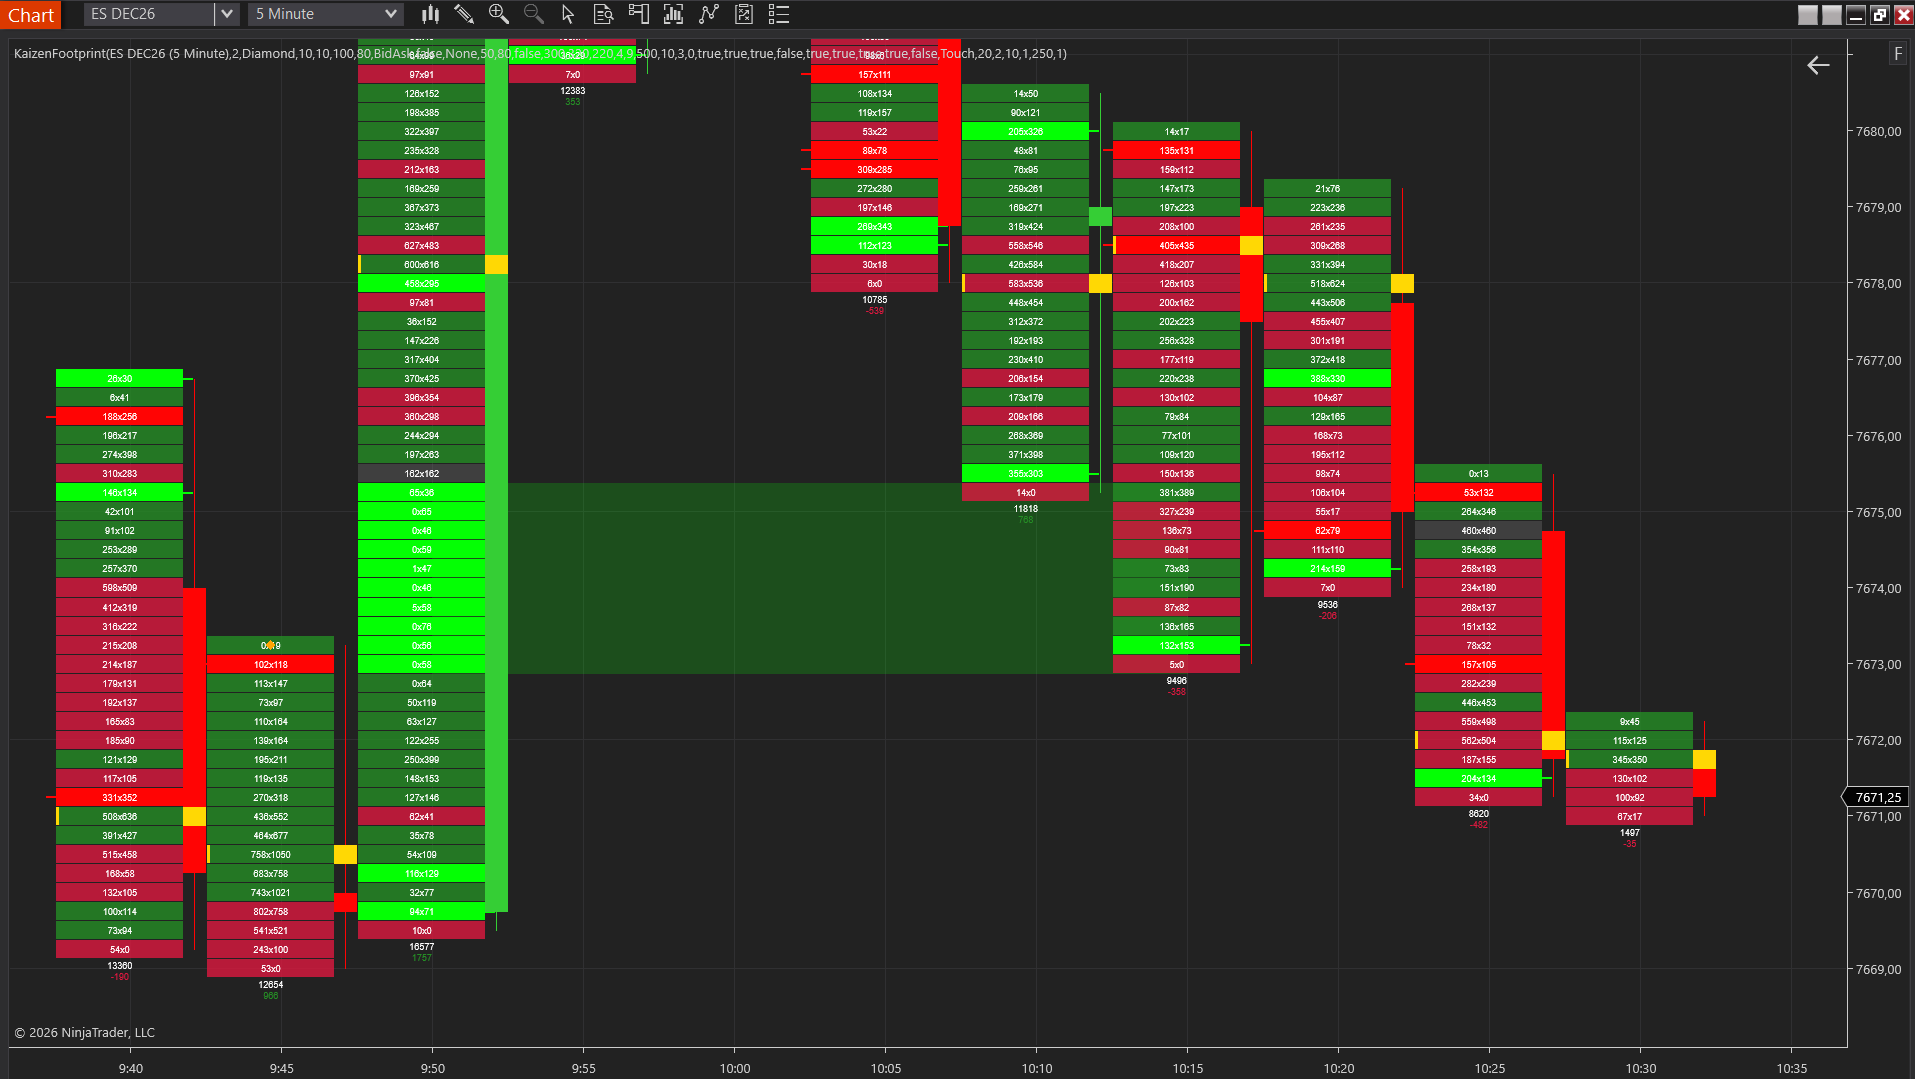
Footprint charts let you spot imbalances (one side heavily outweighing the other at a price), absorption (heavy aggression that fails to move price because passive orders are soaking it up), and exhaustion. If you want the full walkthrough, start with our complete footprint chart guide, then see how to read order flow for a practical reading routine.
Cumulative delta (CVD)
Cumulative delta plots the running total of buy versus sell aggression across the session in its own panel. It is the fastest way to read the trend of who is pressing the market without staring at every cell of a footprint. Kaizen CVD renders it as candles or a line with a session reset, which makes divergences between price and aggression easy to see.
Large-trade detection
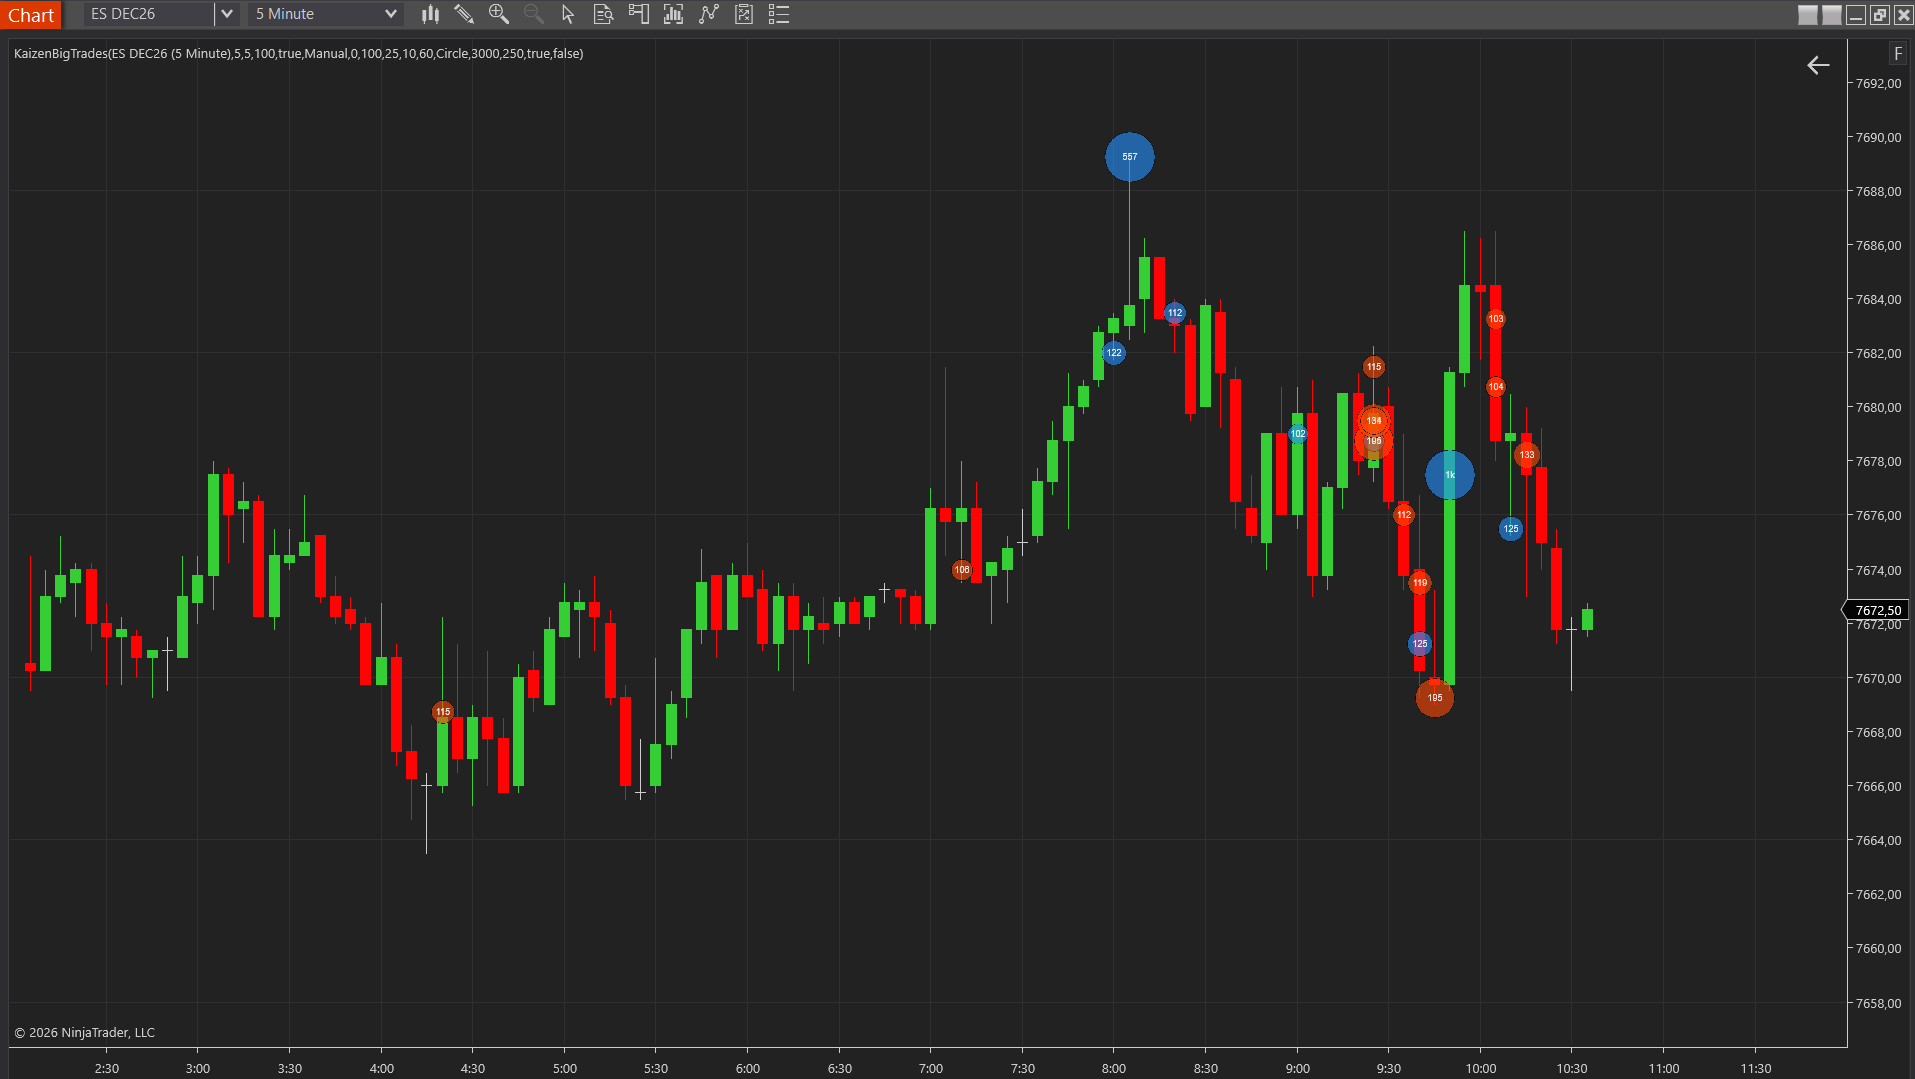
Not all volume is equal. A single large aggressive order carries more information than a hundred small ones, because it usually signals a participant with size and conviction. Large-trade tools mark those executions on the chart so you can see when a big player steps in. Kaizen Big Trades highlights large aggressive orders as size-proportional markers and can auto-calibrate its threshold so you only see the most significant prints of the day.
Volume profile and market profile
Order flow also has a structural layer. Volume profile shows where volume accumulated across a session as a horizontal histogram, marking the high-volume nodes that act as magnets and the low-volume gaps price races through. Its time-based cousin, the TPO or market profile, shows where the market spent the most time. Both give you the map on which the tick-by-tick order flow plays out. For the distinction, see our comparison of volume profile versus TPO market profile and our explainer on what a TPO chart is.
How the Tools Fit Together
No single tool is the whole picture. Experienced order flow traders layer them so each covers the others’ blind spots:
- Structure first. Volume profile, VWAP and prior-session levels tell you where the important prices are before the session even starts.
- Bias next. Cumulative delta gives you the session-level read on which side is pressing.
- Trigger last. The footprint and large-trade markers give you the precise, tick-level confirmation at a level, such as an imbalance stacking up or absorption appearing exactly where structure said it might.
That layering is the real skill of order flow trading. The tools do not tell you what to do; they give you a much higher-resolution view of the auction so your own decisions rest on what the market is actually doing, not on a lagging line.
If you want a category-by-category rundown of every order flow tool and how to choose, our guide to the best NinjaTrader order flow indicators is the natural next read.
Getting Started With Order Flow on NinjaTrader 8
You need three things to begin:
- A platform. NinjaTrader 8 is the common choice for futures order flow and is what the Kaizen tools are built for.
- The right data. Order flow needs a feed that delivers tick-by-tick trades with the bid/ask state attached, both live and for historical backfill. Not every feed does this. We cover exactly which feeds work in our guide to NinjaTrader order flow data feeds.
- Screen time on a simulator. Order flow rewards pattern recognition that only comes from watching it. NinjaTrader’s Market Replay lets you replay recorded tick data with full order flow, so you can practice reading it without risking money.
A sensible learning path is to start with cumulative delta and VWAP, which are easier to interpret, add a footprint chart once you are comfortable, and layer in large-trade detection and volume profile as your reading sharpens. If you also want a read on the broad market alongside your instrument, our free market internals dashboard (TICK, ADD, TRIN, VIX) is a good complement: internals show breadth, order flow shows the instrument.
Bundle & Save
Order Flow Pro
The complete order flow toolkit
$449
$1163
Save61%
A Realistic Word on Expectations
Order flow is a lens, not a crystal ball. It gives you a clearer view of what buyers and sellers are doing right now, which can genuinely improve your timing and your understanding of why a level holds or breaks. It does not predict the future, and it does not remove risk. Markets can absorb aggression, reverse on news, and invalidate the cleanest read. Treat order flow as better information feeding a disciplined process, size your risk accordingly, and remember that no past pattern guarantees a future outcome.
Frequently Asked Questions
What is order flow trading?
Order flow trading is the practice of reading the actual buying and selling activity in a market, trade by trade, rather than relying only on price and lagging indicators. It looks at who is trading aggressively at the bid versus the ask, how much size is transacting at each price, and where large participants are stepping in, to judge the balance of supply and demand in real time.
What is order flow in simple terms?
Order flow is the stream of orders hitting the market: every market buy that lifts the ask and every market sell that hits the bid. Aggregated, that stream shows whether buyers or sellers are the aggressors and where real size is committed. Order flow tools turn that raw stream into readable charts.
Is order flow trading good for beginners?
Order flow has a steeper learning curve than basic indicators because you are reading raw market activity rather than a smoothed line. That said, beginners can start with the more digestible tools such as cumulative delta and VWAP, then add footprint charts as they build intuition. Practicing on a simulator or market replay first is strongly recommended.
What tools do I need for order flow trading?
At minimum you need a data feed that provides tick-by-tick trades with bid/ask state, and a platform such as NinjaTrader 8. On top of that, the common order flow tools are the footprint chart, cumulative delta (CVD), per-bar delta, large-trade detection and volume profile. You do not need Level 2 depth for most of these.
Does order flow trading actually work?
Order flow gives you more information about market activity than price alone, which can improve timing and context. It is not a guarantee of profit and does not remove risk. Like any method, results depend on the trader’s process, discipline and risk management, and past performance does not predict future results.
Related reading
- How to read order flow — the practical reading routine: imbalances, absorption, exhaustion, point of control
- What is delta in trading? — per-bar delta and cumulative delta explained
- Iceberg orders explained — how absorption reveals hidden size
- What is VWAP? and What is a TPO chart? — the structural references order flow plays out against
- The complete footprint chart guide and best NinjaTrader order flow indicators
Order flow becomes far easier to read when your tools agree with each other. The Order Flow Pro bundle brings the footprint, cumulative delta, big-trade detection and more into one workspace for NinjaTrader 8. See what is included on the pricing page.