KaizenTPO
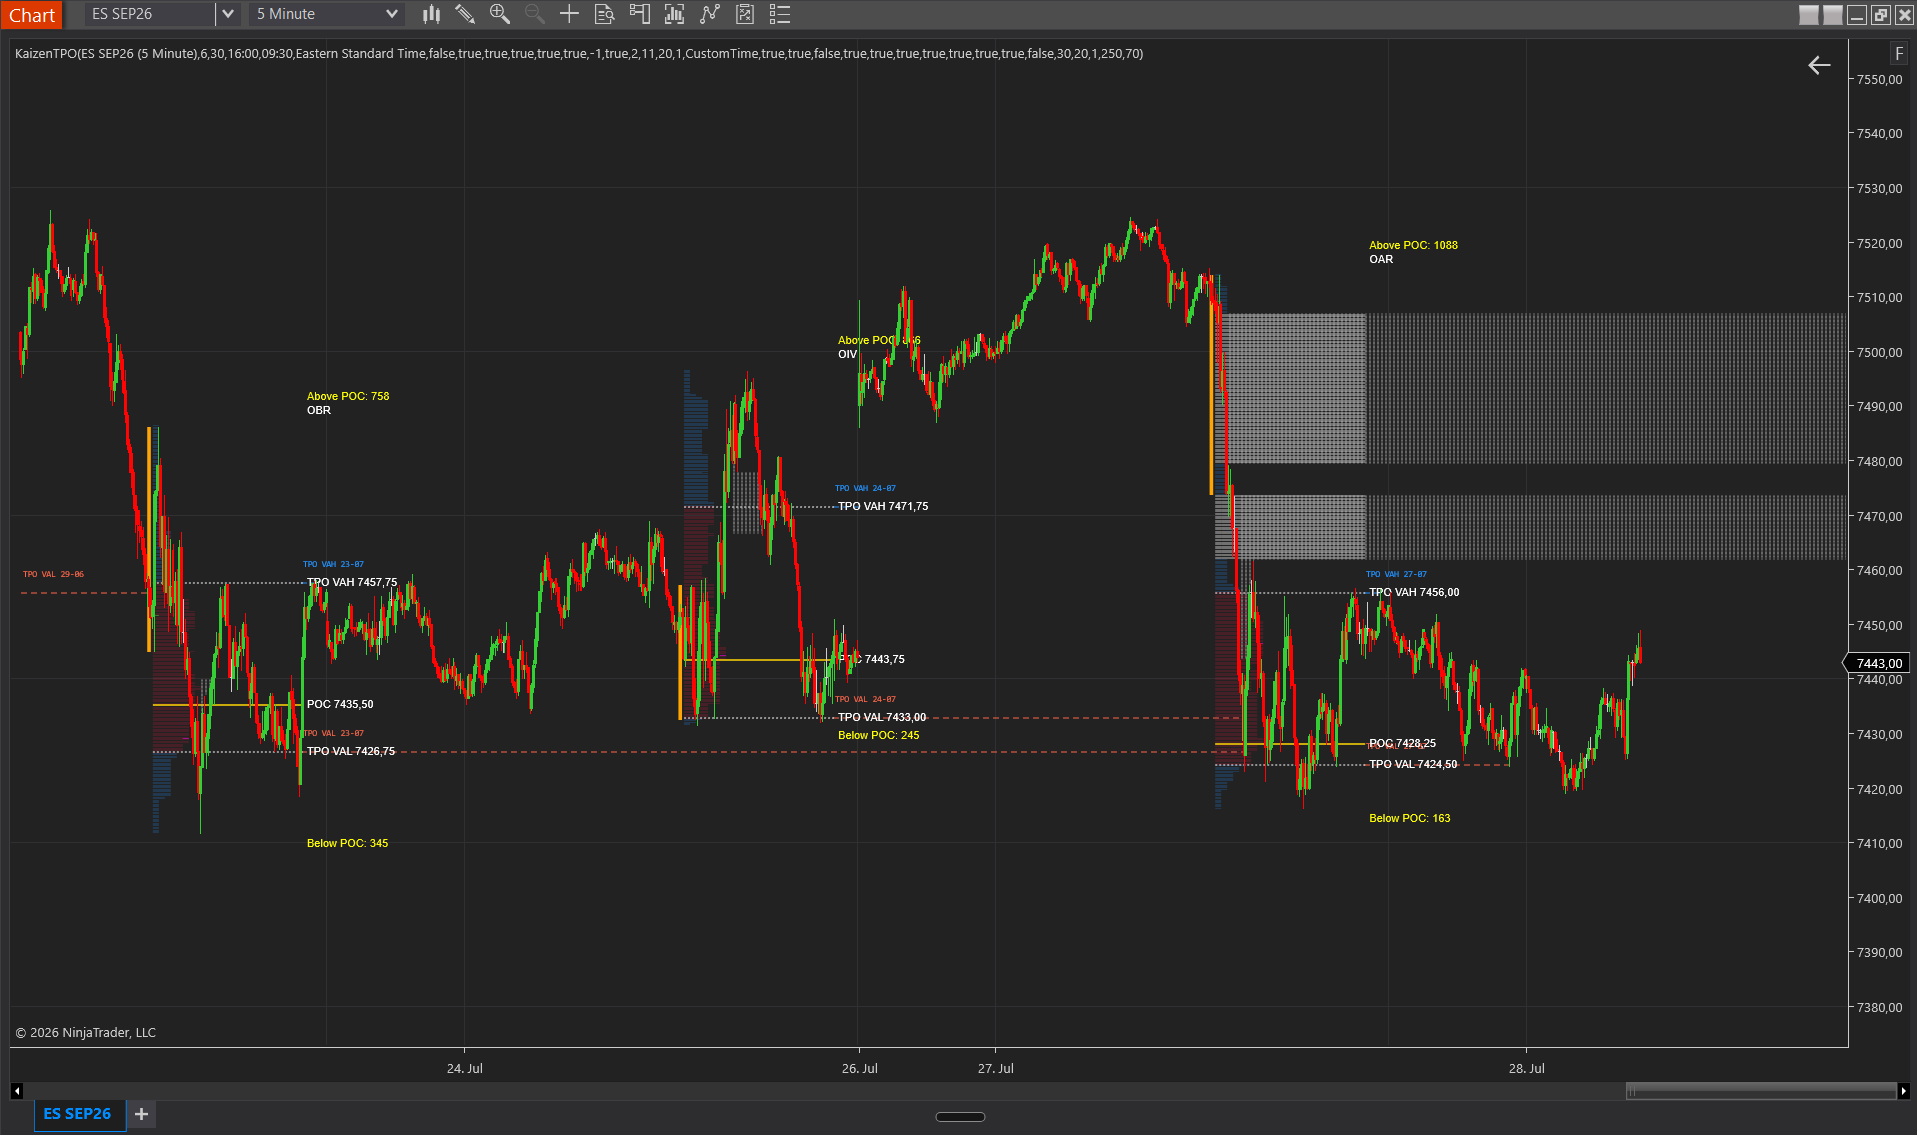
KaizenTPO builds a classic Market Profile by stamping a TPO block at each price visited in every 30-minute period, with Dalton-style columns, single prints and value area.
Updated: August 1, 2026
KaizenTPO builds a classic Market Profile by stamping a TPO block at each price level the market visits during each time sub-period (30 minutes by default). Unlike the volume profile, which weights by contracts traded, the TPO weights by time: a level touched in 5 distinct sub-periods gets 5 TPOs, regardless of whether 10 or 10,000 contracts passed through it. The result is a distribution shape that reveals how long the market accepted each price.
Interpretation
- POC (most TPO prints) — the period’s “fair price in time”. The market spent more half-hours rotating here.
- Single prints — levels touched by a single sub-period. They mark zones the market crossed quickly (one-sided moves) and tends to revisit to “fill in” the gap; they are common reversal or mean-reversion targets.
- Initial Balance (IB) — range of the first N sub-periods (default 2 = first 60 minutes with 30-min sub-periods). IB breakouts classify the day types (Normal Day, Trend Day, etc.) in the classic Market Profile playbook.
- Opening block — TPO blocks stamped during the first sub-period. Highlight it to see the opening auction range at a glance.
- Closing block — blocks stamped during the most recent sub-period. In a live session it shows where the market is currently building activity.
- Profile shape — a narrow, tall profile indicates a trend day (the market rotated within a small range many times); a wide, flat profile indicates a balance or range day with broad bilateral rotation.
Single-print mitigation (live)
Single prints are tracked and updated in real time. As soon as a new sub-period touches a price that used to be a single print, that level is removed from the singles list: the “gap” has been filled. Traders can use this to track which singles remain active as targets.
Open Type classification (v1.8 — Mind Over Markets / Dalton standard)
At the start of the session, today’s open is automatically classified against the previous day’s profile and a compact badge is rendered above the profile:
- OAR (Open Above Range) — Open > previous day’s High.
- OBR (Open Below Range) — Open < previous day’s Low.
- OAV (Open Above Value) — in range, > previous day’s VAH.
- OBV (Open Below Value) — in range, < previous day’s VAL.
- OIV (Open In Value) — between previous day’s VAL and VAH.
Trader use: OAR/OBR signal trend-day setups (strong directionality expected). OIV is typical of range days. OAV/OBV are often acceptance or rejection setups depending on subsequent activity.
Changed in v2.3: the classification now always uses the 09:30–16:00 ET RTH open against the previous RTH range and value area, independent of the chart’s trading hours and of the profile mode. Previously it took the open of the bar that starts the profile — on a CME ETH template that is the 18:00 bar, which compared the overnight open against the overnight range. Classes therefore change on 24-hour charts, and the badge only appears from 09:30 ET: before that there is no RTH open to classify. KaizenVolumeProfile and KaizenStatsProfile read the same source, so all three displays agree.
TPO labels and Volume Profile distinction (v1.8)
The VAH/VAL line labels are now called “TPO VAH” / “TPO VAL” instead of just “VAH”/“VAL”. This makes them unambiguous when TPO and Volume Profile run together on one chart (Volume Profile keeps “VAH”/“VAL”).
Opening and Closing block highlight
Each row of a TPO profile is actually a horizontal stack of blocks, one per sub-period that touched the price. The highlight paints the first (leftmost, oldest) or last (rightmost, newest) block in a distinctive color, making the opening range and the current period’s activity stand out visually.
Dalton view: sub-period columns (new in v2.2)
By default all TPOs of a price row are collapsed to the left: compact, but the temporal order is only readable through block color. With Split Into Sub-Period Columns, every sub-period gets its own vertical column: column 1 = period A, column 2 = period B, and so on. This is the expanded layout from Dalton’s Mind Over Markets.
Why it helps: you see at a glance when the market accepted which prices. A profile that steps upward column by column is a trend day under construction; a profile oscillating around the same center is balance. Single prints in the left-hand area (early periods) are the classic opening “auction gaps”.
Column width follows the Sub-Period (Minutes) setting: at 30 min you get one column per half-hour bracket, at 15 min twice as many, narrower columns. The option works both with blocks and with the letter rendering (Show Letters). On compressed charts the expanded view can get wide; reduce Block Width (px) or drop Max Lookback Profiles to 3–5.
Naked Value Area (untouched prior VAH/VAL)
Independently of single prints, the indicator tracks the VAH/VAL of finalized profiles that have not been revisited since, and projects them forward as dashed lines. As soon as price touches such a line, it terminates. Naked VAH/VAL follow the same logic as naked POCs: unfinished auction business the market tends to come back for, only referenced to the value-area boundaries instead of the POC. With Show Date Label the origin session is printed next to the line (for example TPO VAH 11-05), so you immediately see how old the level is.
Settings
Profile
- Profile Mode — Session = resets at the exchange session open. Daily = resets at the trading day change. Weekly = one profile per trading week. CustomTime = accumulates only between the start/end times (for example only RTH on a 24h future).
- Custom Start Time — CustomTime only: HH:mm (for example 09:30).
- Custom End Time — CustomTime only: HH:mm (for example 16:00). From v2.3 the window is evaluated as (start, end]: the bar stamped with the start time still belongs to the previous period and drops out, and the bar stamped with the end time belongs to the window. NinjaTrader stamps bars with their closing time, so previously a premarket bar slipped in at the front and the closing bar fell out at the back.
- Custom Time Zone — CustomTime only: Windows time-zone ID. Default Eastern Standard Time (handles daylight saving).
- Sub-Period (Minutes) — duration of each TPO slice. Default 30. Lower (15) = more sub-periods per session, finer temporal detail, more meaningful single prints. Higher (60) = fewer, coarser sub-periods. In a 6.5h RTH session: 30 min → 13 sub-periods, 60 min → 7.
- Ticks per Row — price-level aggregation. 1 = each tick is a row. Higher values compress rows for better readability. On ES: 2 gives 1 row per 0.50 pt; 4 = 1 row per whole point.
- Value Area % — percentage of TPOs (not volume) that form the VA. Default 70 (Steidlmayer classic). Higher = wider VA.
- Enable Composite Mode — merges consecutive profiles with similar VAs into a composite, same mechanism as Volume Profile. Default off.
- Composite Tolerance % — maximum % of drift between VAs to merge. Default 30.
Display
- Show POC — highlights the row with the most TPO prints.
- Show Value Area — draws the VAH/VAL boundaries.
- Show Single Prints — highlights levels with only 1 TPO print (in a separate color).
- Extend Single Prints — projects the single-print levels as horizontal rays to the right, making them visible as future targets.
- Show Initial Balance — draws IB High and IB Low lines from the first N sub-periods.
- IB Sub-Periods — number of sub-periods that define the IB. Default 2 (= first 60 min with 30-min sub-periods). Set 4 for a 2-hour IB, 1 for a 30-min opening range.
- Show Labels — price labels for POC, VAH, VAL (and IB if shown).
- Block Width (px) — width of each TPO block. Default 6. Larger blocks are easier to scan but invade price; smaller blocks compress more history.
- Draw In Front Of Bars — (new in v2.3) draws the profile over the price bars instead of behind them. Useful when a wide candle covers the letters. Default off, so existing charts look unchanged.
- TPO Opacity % — transparency 0–100. Default 20, very transparent so the candles behind remain visible.
- Highlight Opening Block — paints the first block of each row with the Opening Block Color, making the opening auction visible.
- Highlight Closing Block — paints the last block of each row with the Closing Block Color, showing which levels the current sub-period is actively stamping.
- Highlight Value Area Blocks — paints all blocks inside the VA with a distinctive color so the VA stands out visually.
- IB as Vertical Bar — renders the IB as a single vertical bar at the edge of the profile instead of stamping it on each row. Cleaner look on compressed charts.
- Split Into Sub-Period Columns — (new in v2.2) Dalton-style expanded view: every sub-period gets its own vertical column instead of collapsing all TPOs to the left. Column duration follows Sub-Period (Minutes). Applies to blocks and letters. Default off.
Colors
- TPO Box Color — default color of the TPO blocks. Default DodgerBlue.
- Single Print Color — levels with only 1 TPO. Default Silver.
- POC Color — the Point-of-Control line. Default Gold.
- Value Area Color — VAH/VAL lines. Default White.
- IB Color — Initial Balance High/Low lines. Default Orange.
- Opening Block Color — first sub-period blocks when Highlight Opening Block is active. Default LimeGreen.
- Closing Block Color — last sub-period blocks when Highlight Closing Block is active. Default Magenta.
- Value Area Block Color — VA blocks when Highlight Value Area Blocks is active. Default Crimson.
- Label Text Color — text color for the POC, TPO VAH, TPO VAL and Open Type (v1.8) labels. Default White.
Performance
- Max Lookback Profiles — number of past profiles kept on the chart. Default 20, higher than Volume Profile because TPO data is lighter in memory.
- Update Interval (ms) — throttle for live profile redraws. Default 250 ms.
Naked Value Area
- Show Naked VAH — draws a forward-extending dashed line from each finalized profile’s Value Area High, until price touches it. Default on.
- Show Naked VAL — the same for the Value Area Low. Default on.
- Show Date Label — shows the origin session next to each naked line (for example TPO VAH 11-05).
- Naked Line Width — stroke width of the naked lines.
- Naked VAH Color — color of the untouched VAH lines. Default DodgerBlue.
- Naked VAL Color — color of the untouched VAL lines. Default Tomato.
Letters
- Show Letters — renders AMT-style letter blocks (A, B, C …) instead of colored boxes. Each letter = one sub-period. Default off. This is the classic Market Profile look from the Chicago trading floors.
- Letter Font Size — font size of the letters. Default 11. With Ticks per Row = 1 on ES, drop to 8–9 so the rows do not overlap.
- Hide Blocks When Letters Shown — suppresses the colored blocks when letters are on (pure AMT look). Off = letters are overlaid on top of the blocks. Default on.
- Letter Color — text color of the letters. Default White.
POC Counts
- Show POC Block Counts — displays the number of TPO blocks above and below the POC, a direct measure of auction asymmetry. Substantially more TPOs above the POC = the auction spent more time above fair price (upward distribution), and vice versa. Default off.
- POC Count Color — text color of these counters.