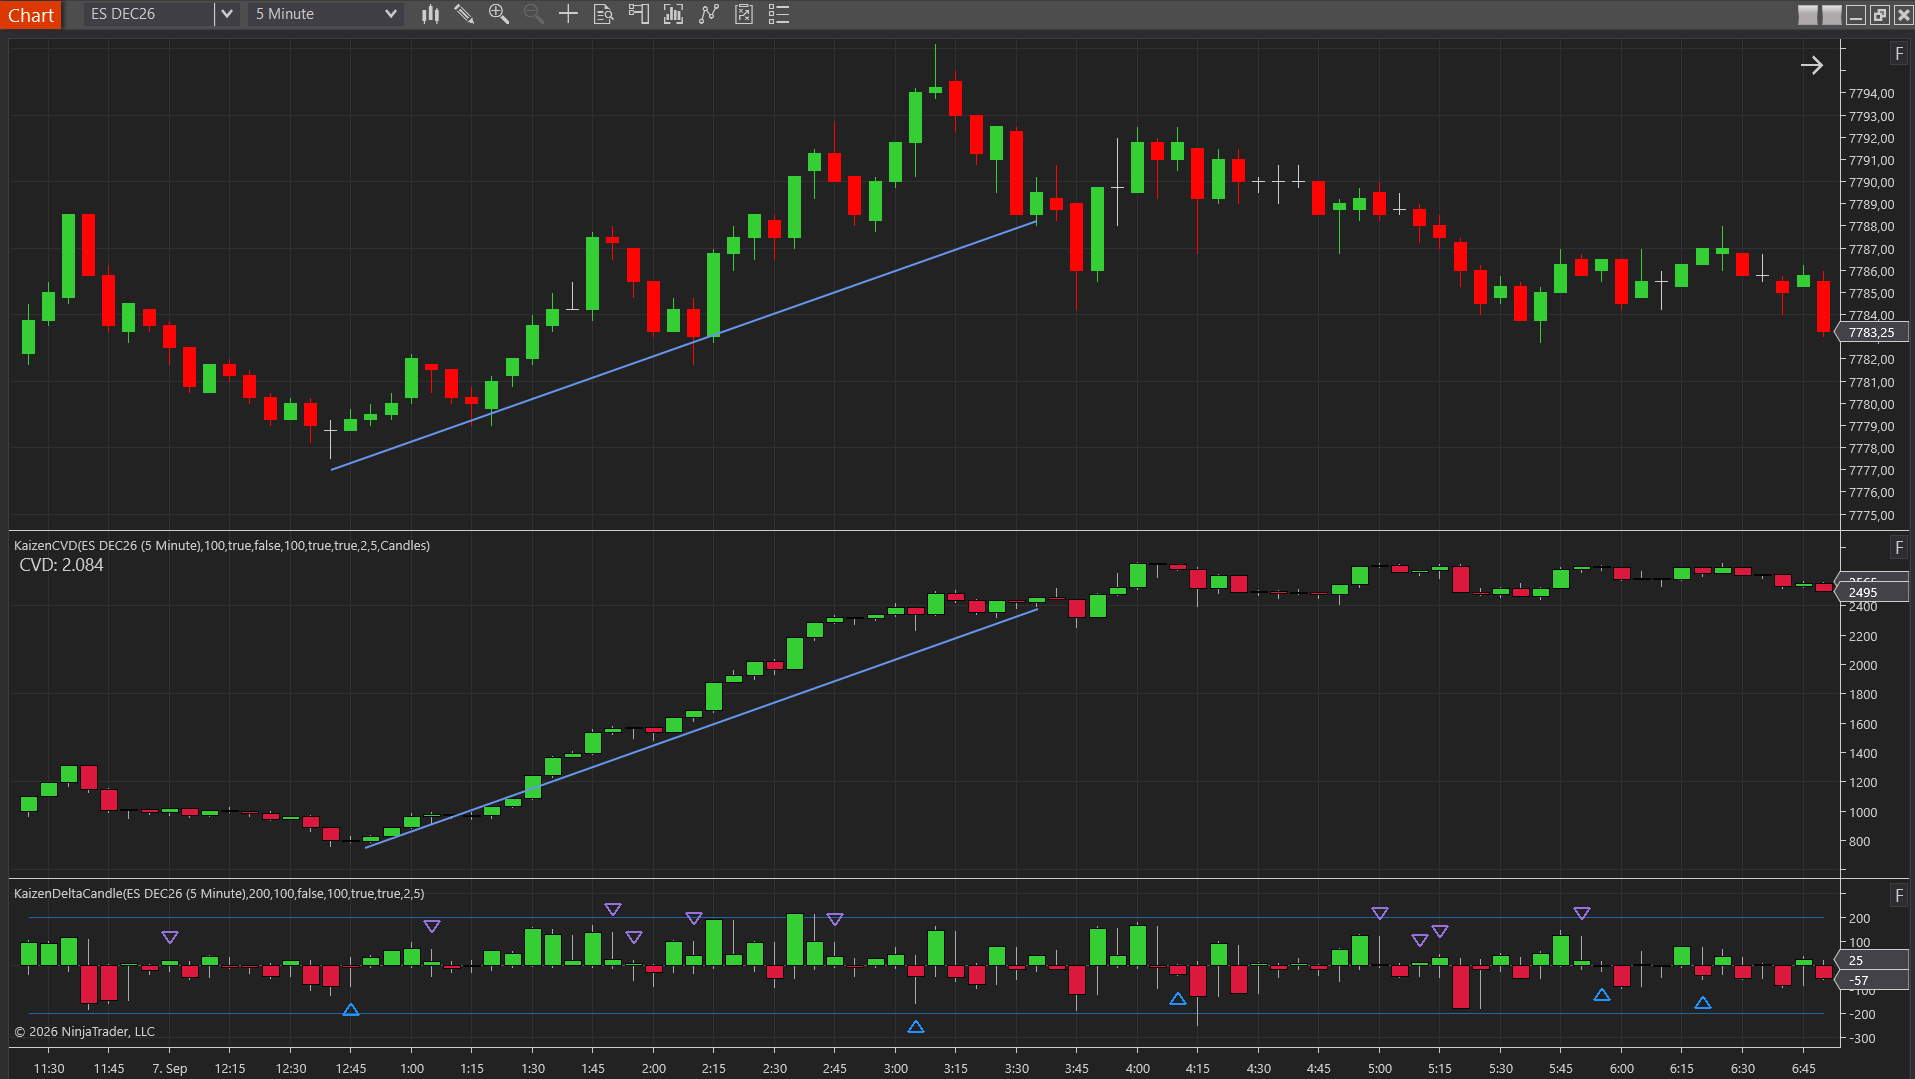
In order flow trading, delta is the difference between volume that traded at the ask and volume that traded at the bid. Positive delta means aggressive buyers were in control; negative delta means aggressive sellers were. It is the most direct way to measure which side is pressing the market, and when you add it up across a session you get cumulative delta, or CVD, one of the most useful order flow tools there is. This guide explains what delta is, how cumulative delta works, and how to read both on NinjaTrader 8.
One quick clarification first, because the word is overloaded. This article is about order flow delta (also called volume delta), which is about aggressive buying and selling in futures and equities. It is not options delta, the Greek that measures how an option’s price responds to the underlying. Different concept, same word.
What Is Delta?
Every trade that prints happens either at the bid or at the ask. A trade at the ask means an aggressive buyer crossed the spread to buy now. A trade at the bid means an aggressive seller crossed the spread to sell now. Delta simply nets these against each other:
Delta = volume traded at the ask − volume traded at the bid
If 1,200 contracts traded at the ask and 700 at the bid during a bar, the delta for that bar is +500. Aggressive buyers did more work than aggressive sellers. If the numbers were reversed, delta would be −500 and sellers would have been the aggressors.
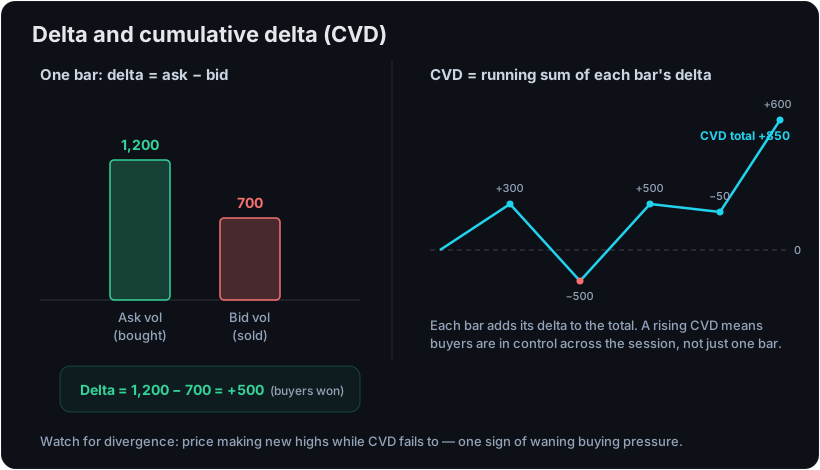
This is powerful because it separates the aggressive side from the passive side. Price can rise on aggressive buying, or it can rise simply because sellers stepped away and it took very little buying to lift it. Delta tells you which. Two identical green candles can carry completely different deltas, and that difference often matters more than the candle itself.
From Per-Bar Delta to Cumulative Delta
Delta comes in two flavors, and you want both.
Per-bar delta shows the aggression inside a single candle. On NinjaTrader 8, Kaizen Delta Candle plots this as its own candle that opens at zero and closes at the bar’s delta, so you can see at a glance how hard one side pushed inside each bar and whether that push is growing or fading.
Cumulative delta (CVD) keeps a running total of every bar’s delta from the session open, so you see the trend of aggression build over the whole day rather than one candle at a time. Kaizen CVD renders this as candles or a line in a lower panel with a session reset, which is the standard way traders track who is winning the auction over hours. Every CVD setting is covered in the CVD documentation.
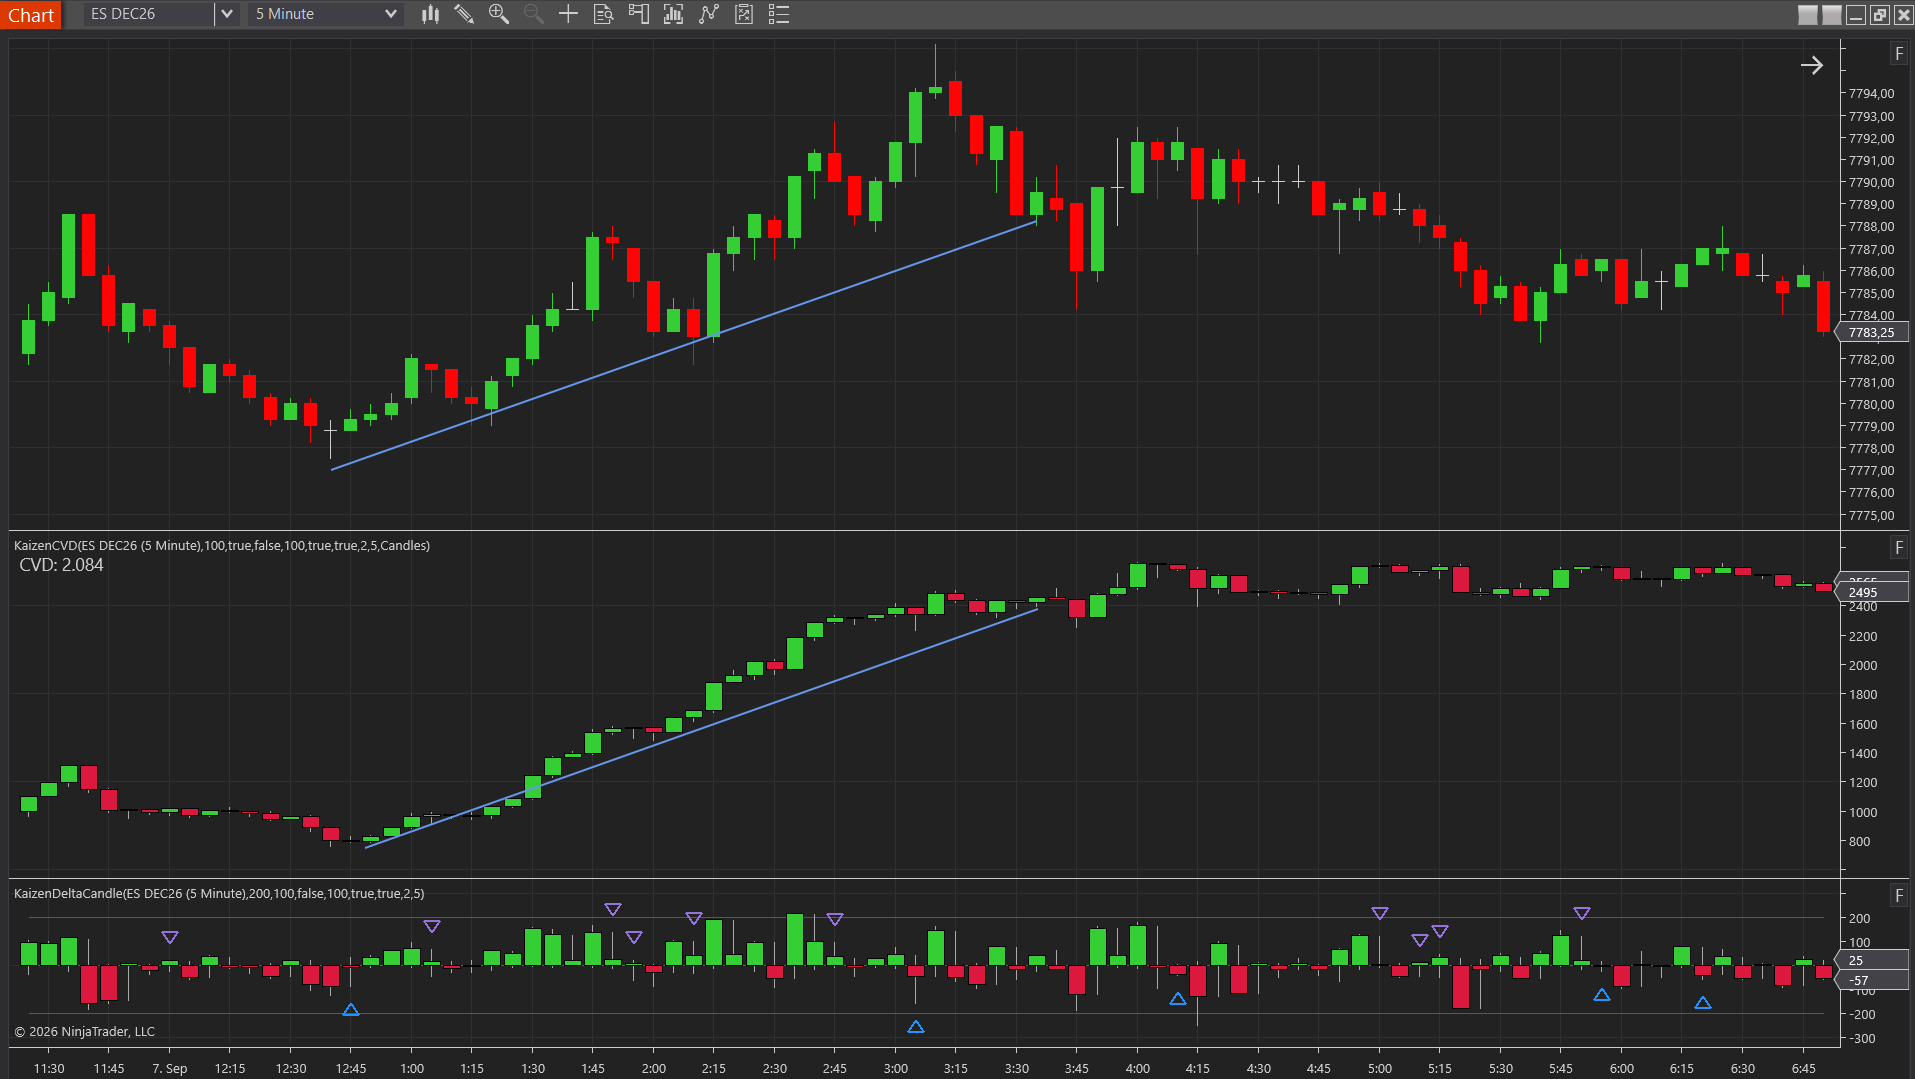
The relationship between the two is straightforward: CVD is just the running sum of the per-bar deltas. A string of positive per-bar deltas drives CVD up; a string of negative ones drives it down. Reading them together gives you both the moment-to-moment aggression and the session-long trend.
Reading Delta: What Traders Look For
Confirmation
The simplest read is confirmation. In a healthy uptrend, price makes higher highs and CVD makes higher highs alongside it, telling you aggressive buyers are genuinely driving the move. When price and delta rise together, the move has real aggression behind it.
Divergence
The read that gets the most attention is divergence, when price and cumulative delta disagree. If price grinds to a new high but CVD fails to make a new high, aggressive buying is not confirming the move. The rally is being carried by something other than fresh aggression, often just a lack of sellers, and that is a warning the push may be running low on fuel.
Divergence is a warning, not a trigger. Markets can diverge for a long time before anything happens, and plenty of divergences simply resolve by the other side stepping back in. Traders use it to raise their alertness at a level, then wait for confirmation, rather than shorting a new high just because CVD lagged. Our guide to how to read order flow shows how delta confirms footprint patterns inside a full reading routine.
Absorption
Delta also reveals absorption. When you see a large delta in one direction but price fails to move with it, a passive participant is absorbing all that aggression. Heavy positive delta with no upward progress means aggressive buyers are being met by a hidden seller. Kaizen Delta Candle marks this kind of absorption directly, flagging bars where delta and price direction disagree.
Kaizen CVD
essentialCumulative Volume Delta as candles or line — read buy/sell pressure
$99
Lifetime license
Delta at Price: The Next Layer
Standard CVD tells you the aggression trend for the session as a whole. A delta profile takes it a step further and shows you the accumulated delta at each individual price level, much as a footprint chart does bar by bar, so you can see exactly which prices aggressive buyers or sellers committed to most heavily. Kaizen Delta Profile builds this delta-at-price histogram and flags the levels where extreme delta lines up with repeated retests, turning raw aggression into concrete support and resistance you can watch.
Where a volume profile shows how much traded at each price, a delta profile shows who won at each price. The two are complementary, and together they give you both the amount of business and the direction of the aggression behind it.
A Practical Note on Data
Delta is only as accurate as the data behind it. Because it depends on classifying each trade as hitting the bid or lifting the ask, you need a feed that delivers tick-by-tick trades with the bid/ask state attached, and for accurate historical delta NinjaTrader needs Tick Replay enabled on the chart. If your delta looks wrong or your footprint loads blank, the data feed is almost always the culprit. Our guide to NinjaTrader order flow data feeds covers exactly which feeds work and why.
Bundle & Save
Order Flow Pro
The complete order flow toolkit
$449
$1163
Save61%
A Realistic Word on Expectations
Delta gives you a genuinely better view of the auction than price alone, because it separates aggression from outcome. But it is one input, not an answer. Divergences can persist, absorption can break, and delta can be distorted on thin, illiquid instruments or by unusual prints. Read it alongside price, structure and your own plan, define your risk, and remember that a pattern that worked before does not guarantee it will work again. Practicing on a simulator or NinjaTrader’s Market Replay is the fastest way to build a feel for how delta behaves.
Frequently Asked Questions
What is delta in trading?
In order flow trading, delta is the difference between volume that traded at the ask and volume that traded at the bid over a given period. Positive delta means aggressive buyers dominated; negative delta means aggressive sellers dominated. It is a direct measure of which side was pressing the market. This is different from options delta, which measures an option’s sensitivity to the underlying price.
What is cumulative delta (CVD)?
Cumulative delta, or CVD, is the running total of each bar’s delta across the session. Instead of showing aggression one bar at a time, it accumulates it into a line or candle series so you can see the trend of buying versus selling pressure building over hours. It usually resets at the session open.
What is delta divergence?
Delta divergence is when price and cumulative delta disagree. For example, price makes a new high but CVD fails to make a new high, showing that aggressive buying is not confirming the move. It is a warning that the current push may be running out of fuel, though it is not a guaranteed reversal signal.
Is order flow delta the same as options delta?
No. Order flow delta measures aggressive buy volume minus aggressive sell volume and is used to read the futures and equities auction. Options delta is one of the option Greeks and measures how much an option’s price moves for a one-point move in the underlying. This guide is about order flow delta.
What data do I need to calculate delta?
Delta requires tick-by-tick trade data with the bid/ask state attached, so the platform can classify each trade as hitting the bid or lifting the ask. A standard Level 1 order flow feed provides this. For accurate historical delta, NinjaTrader also needs Tick Replay enabled on the chart.
Related reading
- How to read order flow — delta as the confirmation layer in a reading routine
- What is order flow trading? — the aggressive vs passive split delta measures
- Iceberg orders explained — heavy delta with no price progress, the absorption tell
- The complete footprint chart guide — delta at every price inside the bar
- Kaizen CVD and its documentation
Want to track buying and selling pressure on your charts? Kaizen CVD, Kaizen Delta Candle and Kaizen Delta Profile cover delta from the session trend down to the individual price level, and all three are part of the Order Flow Pro bundle. Compare everything on the pricing page.