KaizenCVD
KaizenCVD plots Cumulative Volume Delta for the session as OHLC candles or a line, showing whether aggressive buyers or sellers dominate, with session reset and full settings.
Updated: July 1, 2026
KaizenCVD (Cumulative Volume Delta) keeps a running total of (ask-initiated volume − bid-initiated volume) accumulated from the session start and reset at each new session. It renders as an OHLC candle per price bar (high/low show the session delta extremes touched during the bar; close is the current running total) or as a single continuous line.
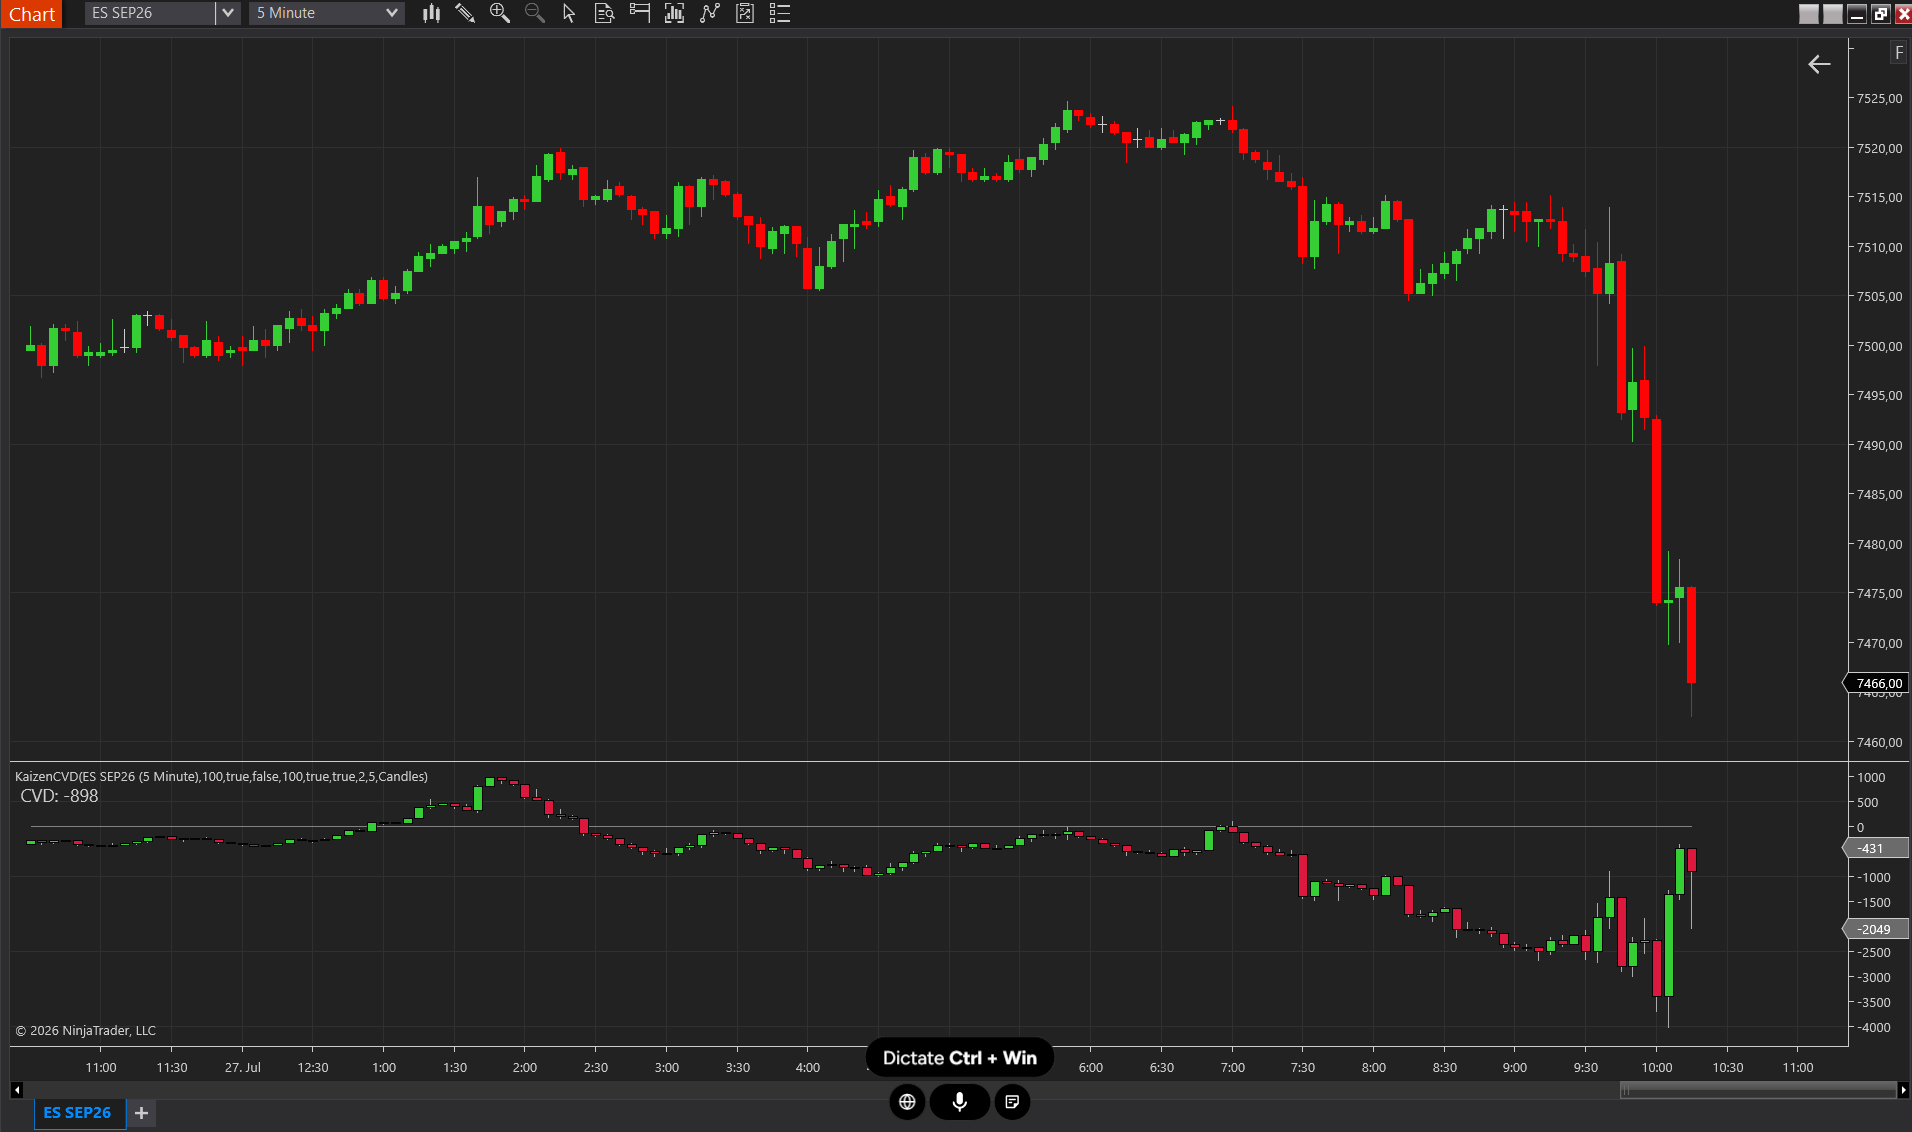
Interpretation
- Above zero = the session is net-bullish, with dominant ask-side aggression. Below zero = net-bearish.
- CVD rising while price ranges = accumulation (buying against a wall of supply). It usually precedes an upside breakout.
- CVD falling while price ranges = distribution. It usually precedes a downside breakout.
- Price–CVD divergence — a new price high without a new CVD high indicates buy-side weakness; a new price low without a new CVD low indicates sell-side weakness.
- The zero line is absolute, not a moving average. Session-to-session comparisons are meaningless (yesterday’s +500 is on a different scale from today’s +500).
- Intra-bar high/low (Candles mode) — shows the maximum and minimum CVD reached during the bar: a large wick on a small-bodied candle means the delta swung sharply and then re-centered.
Per-session reset behavior
The CVD resets to 0 at Bars.IsFirstBarOfSession. This happens mid-bar if necessary, so every first bar of a new session opens at CVD=0 regardless of overnight activity. Tick Replay is required in historical mode for accurate delta classification (per-tick bid/ask info).
With Enable Session Reset = false the CVD runs continuously across sessions, without resetting. That is the mode for multi-day analysis: institutional accumulation or distribution frequently spans several days, and a divergence covering three sessions is only visible in this mode. For classic intraday trading the default (true) is still the right one, since only then does the zero line mean “net bullish/bearish for today”.
Divergence detection
With Highlight Divergences active, the indicator looks for swing pivots in price and in the CVD and connects them with a line when the two contradict each other:
- Bearish divergence — price makes a higher high and the CVD a lower high. The breakout was not backed by aggressive buyers.
- Bullish divergence — price makes a lower low and the CVD a higher low. The new low was not backed by aggressive sellers.
A pivot is only considered confirmed once Swing Lookback bars to its left and right are lower (or higher). By design, a divergence line therefore appears Swing Lookback bars after the pivot; this is not indicator lag, it is the time needed to confirm a pivot. Higher values give fewer but more meaningful pivots.
Fixed in v2.2: divergence lines are no longer drawn across the session reset (the CVD’s jump to 0 looked to the detector like a massive “higher low” and regularly produced a false divergence at the session change). Also fixed: scrolling back more than ~256 bars flattened the CVD curve while the divergence lines stayed fixed, which made them look “detached”.
Settings
Settings
- Visual Mode — Candles = OHLC per bar (watch the wicks for session extremes). Line = a single continuous line (cleaner, no OHLC detail).
- Show Zero Line — draws a horizontal reference at CVD = 0. Essential for quickly reading whether the session is net-bullish or net-bearish.
- Show Labels — a text label at the top left showing the current CVD value, updated with each tick.
Colors
- Positive Delta Color — candle fill when close > open (delta rising). Default LimeGreen.
- Negative Delta Color — candle fill when close < open. Default Crimson.
- Candle Border / Wick Colors — outline and high-low wick colors.
- Line Color — line color in Line mode (ignored in Candle mode). Default DodgerBlue.
- Zero Line Color — reference line at delta = 0.
Visuals
- Candle Opacity % — transparency of the candle fills 0–100. Default 100. Lower it to let other panel indicators show through.
Divergence
- Highlight Divergences — master switch for divergence detection. Default off.
- Swing Lookback (bars) — bars to the left AND right of a bar required to confirm it as a pivot. Default 5. Higher = fewer but more meaningful pivots (and drawn later).
- Swing Line Width — stroke thickness of the divergence lines. Default 2.
- Max Lookback (bars) — maximum bar distance between two pivots. Pivots further apart are not connected. Default 100. Lower it to 30–50 for short-term-only divergences.
- Bullish Divergence Color — color of the bullish divergence lines. Default Cyan.
- Bearish Divergence Color — color of the bearish divergence lines. Default Magenta.
Session
- Enable Session Reset — true (default) = the CVD resets to zero at each session boundary (standard intraday behavior). false = the CVD accumulates across sessions, for multi-day swing divergences where accumulation or distribution spans several sessions.
Requirements
For accurate delta classification in history, Tick Replay must be enabled (see Installation and getting started).