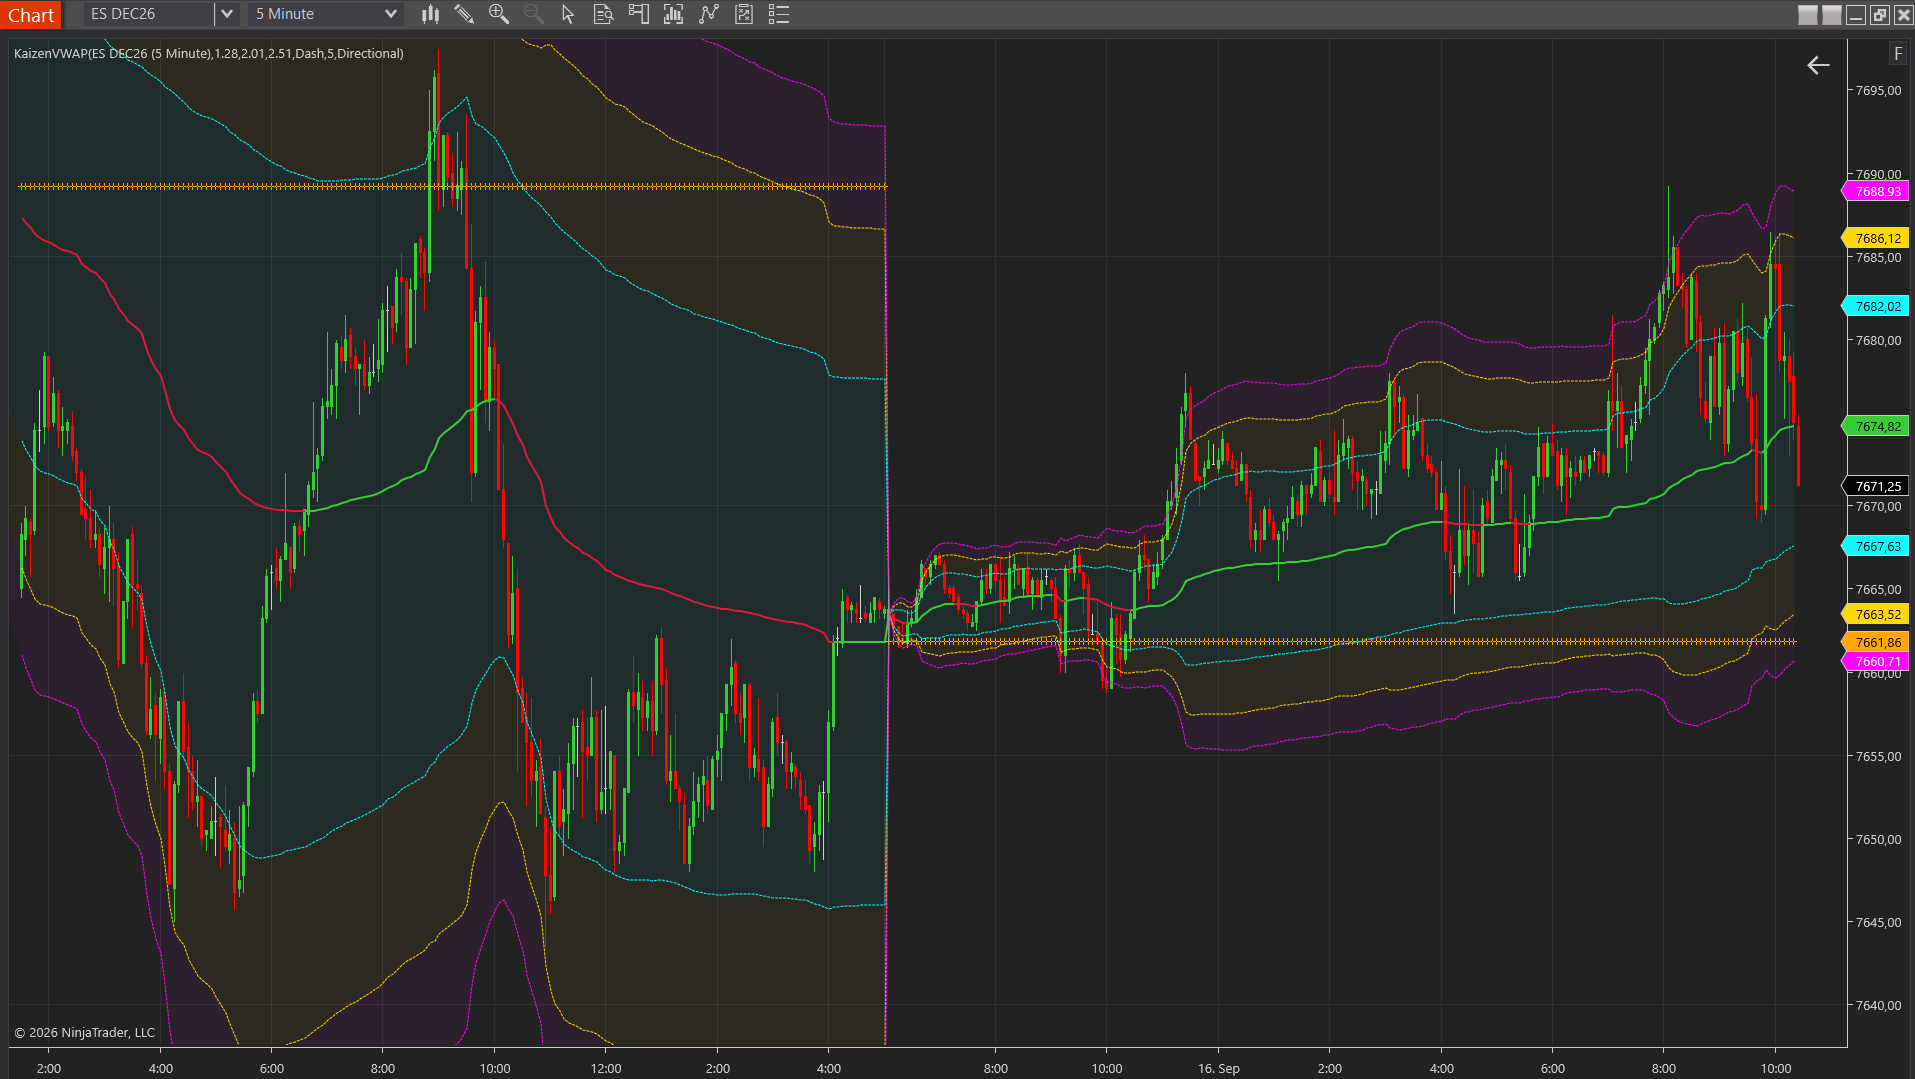
VWAP is the Volume-Weighted Average Price: the average price an instrument has traded at since the session open, weighted by the volume done at each price. Put simply, it answers a question a plain average cannot: not just what the average price was, but the price where the most contracts actually changed hands. That is why VWAP has become one of the most watched intraday reference levels in futures and equities.
This guide explains what VWAP is, how VWAP is calculated, why so many traders and institutions anchor their decisions to it, and how to read it on a NinjaTrader 8 chart. No hype, no signals, just the mechanics and the context you need to use the line sensibly.
What VWAP Actually Measures
Every trade that prints during the day has two pieces of information: a price and a size. A normal average of prices ignores size, so a single 1-contract trade counts the same as a 2,000-contract block. VWAP fixes that. It weights each price by the volume that traded there, so the levels where real size changed hands pull the line toward them.
The result is a single line on your chart that represents the session’s volume-weighted consensus of fair value. When price trades above VWAP, buyers on the day are, on average, in profit and sellers are underwater. When price trades below VWAP, the reverse is true. That simple fact is why the line matters: it is a shared reference that thousands of participants are watching at the same time.
VWAP is not a prediction and it is not a buy or sell signal. It is context. It tells you where the day’s average transaction sits relative to current price, and it lets you frame whether the market is trading rich or cheap against that benchmark.
How Is VWAP Calculated?
The formula is straightforward. For each bar in the session you take the typical price, multiply it by that bar’s volume, and keep a running total. You divide that running total by the running total of volume:
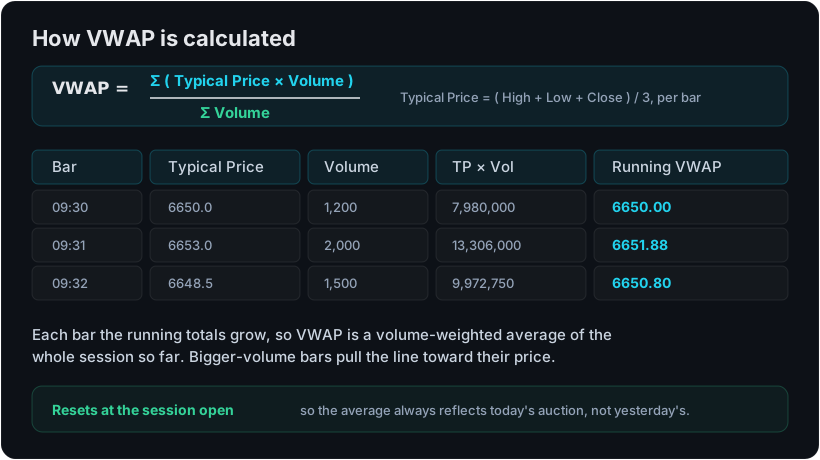
Two details are worth remembering. First, the typical price is usually the high plus the low plus the close of each bar, divided by three, though some implementations use every individual trade price instead. Second, VWAP resets at the start of every session. The moment a new session opens, the running totals go back to zero and the line begins building again from the first trade. That reset is what keeps VWAP anchored to today’s auction rather than dragging in yesterday’s data.
Because the calculation is cumulative, VWAP moves a lot in the first minutes of the session when the totals are small, then stiffens as the day builds volume. By the afternoon it takes a great deal of volume at a new price to shift the line, which is exactly why late-session tests of VWAP tend to carry weight.
Why Institutions Care About VWAP
VWAP started life as an execution benchmark, and that is still its most important role. A fund that needs to buy 5,000 contracts cannot hit the market all at once without moving price against itself. Instead it works the order through the day and measures the quality of its fills against VWAP. Beating VWAP, buying below it or selling above it, is how many desks judge whether their execution was good.
This creates a feedback loop worth understanding. Because large players benchmark to VWAP, they often become buyers when price dips below it and sellers when price pushes above it, at least while the day is balanced. That behavior is part of why price so often gravitates back toward the line on rotational days. You are not the only one watching it.
Reading VWAP on NinjaTrader 8
On a chart, VWAP appears as a single line that starts at the open and curves through the day. Many traders add standard deviation bands above and below it to gauge how stretched price is from the average. Kaizen VWAP plots the session line with directional coloring, three configurable deviation bands with cloud fills, and the prior session’s VWAP as a reference, so you can see both today’s developing average and where yesterday’s closed. Every setting is covered in the VWAP documentation.
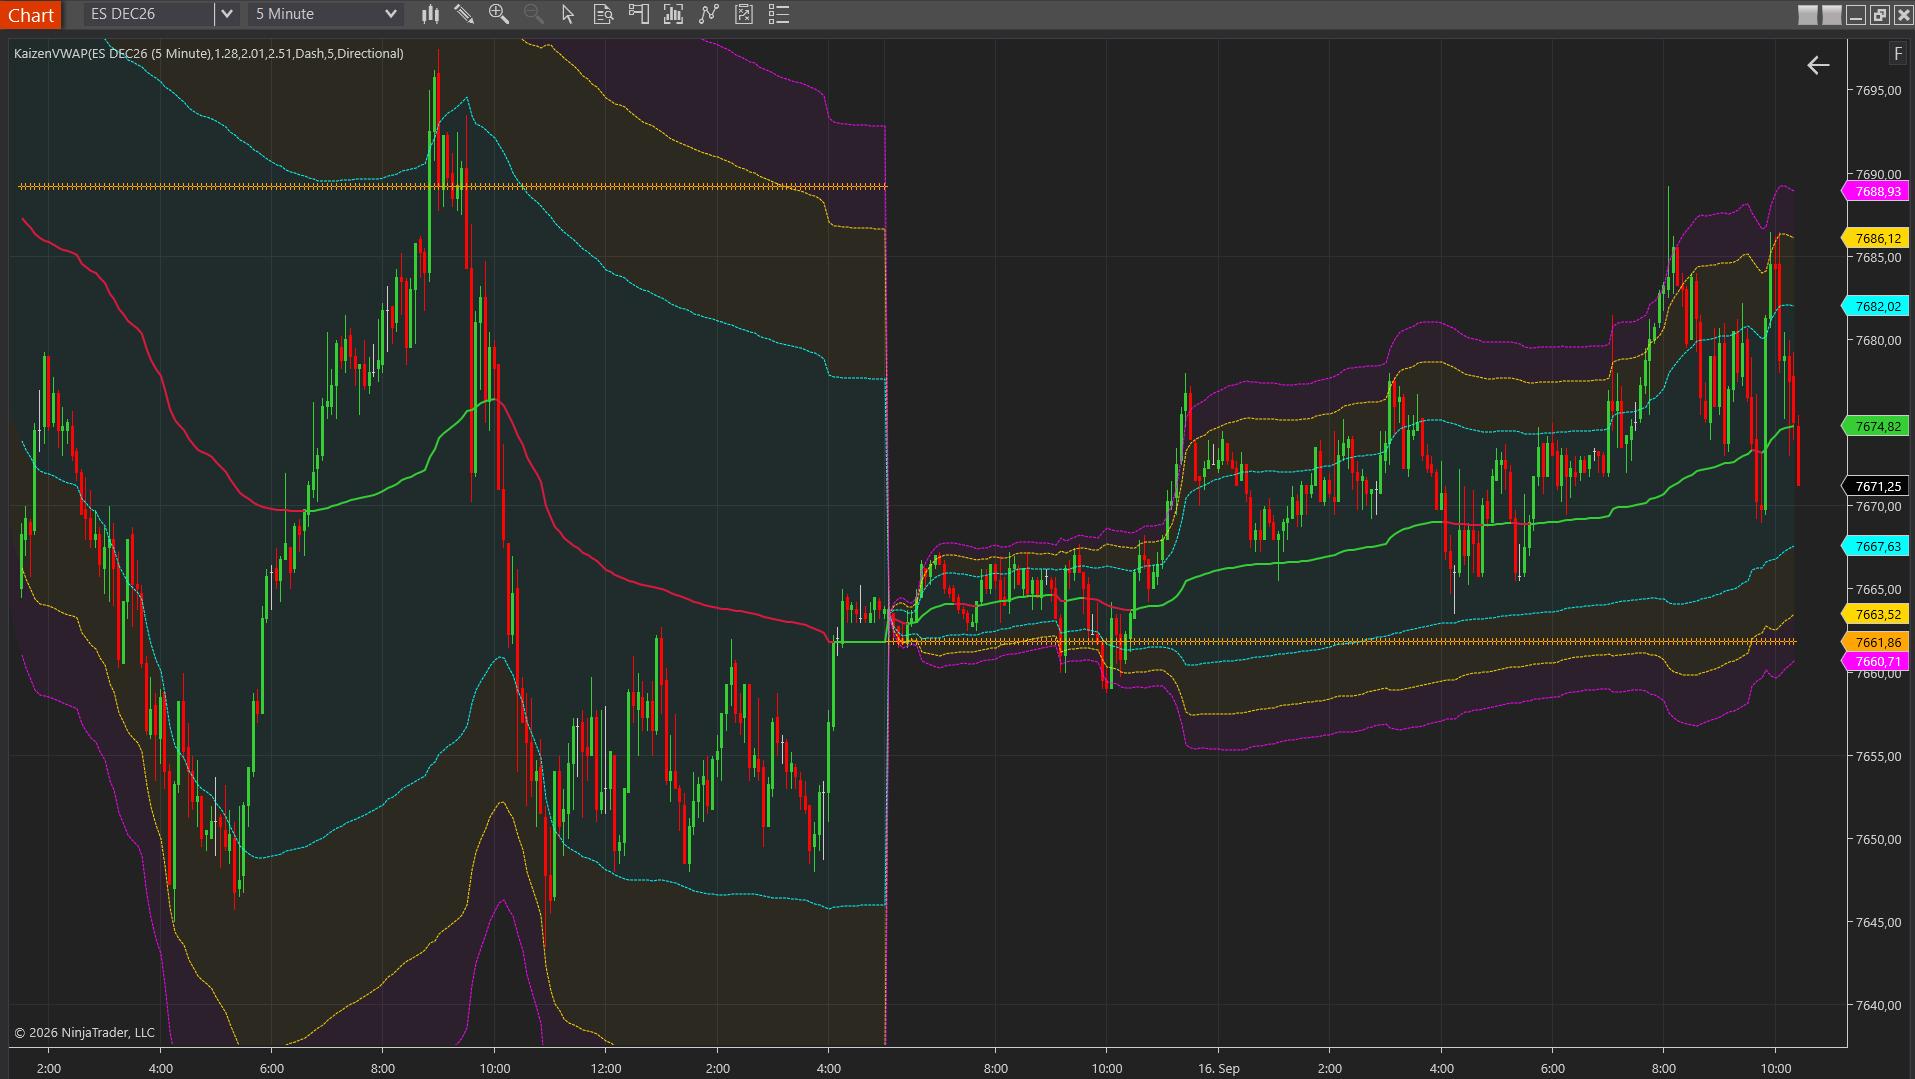
A few practical reads:
- Price above a rising VWAP points to buyers controlling the session so far. Pullbacks toward the line are where trend traders look for the market to resume, rather than a place to fade.
- Price oscillating across a flat VWAP is the signature of a balanced, rotational day. On these days the line often acts as a magnet, and the deviation bands mark the edges of the rotation.
- A clean rejection at VWAP after price approaches from one side tells you the benchmark is being defended. Whether that is meaningful depends on the wider context of the day.
If you want to go deeper into how to actually trade around the line rather than just define it, read our companion guide on how to use VWAP in a trading strategy. For the bigger picture of how VWAP fits alongside order flow tools such as footprint charts, delta and volume profile, see our overview of the best NinjaTrader order flow indicators.
Kaizen VWAP
essentialSession VWAP with directional coloring, 3 SD bands & cloud fills
$99
Lifetime license
VWAP vs Moving Averages
Traders new to VWAP often ask how it differs from a moving average, since both draw a smooth line through price. The difference is what each one weights.
A simple moving average takes the last N closes and averages them equally. It has no memory of volume and no anchor to the session; it simply slides along. VWAP does the opposite. It weights by volume, so heavily traded prices matter more, and it anchors to the session open, so it always describes today’s auction from a fixed starting point. For an intraday futures trader deciding whether the market is rich or cheap right now, that volume weighting and session anchor make VWAP the more informative reference. Neither tool predicts the future; both are ways of summarizing where price has been.
A Note on Expectations
VWAP is a description of where trading has already happened, not a forecast of where it will go. Levels that acted as support all morning can fail in the afternoon when the character of the day changes. Use VWAP as one input alongside market structure, volume and your own plan, and remember that past behavior around the line does not guarantee future behavior. Tools give you better information; they do not remove risk.
Frequently Asked Questions
What is VWAP in simple terms?
VWAP stands for Volume-Weighted Average Price. It is the average price an instrument has traded at during the session, weighted by how much volume traded at each price. Because it accounts for volume, VWAP reflects the price level where the most business actually took place, not just the midpoint of the range.
How is VWAP calculated?
VWAP is the running total of price multiplied by volume, divided by the running total of volume, from the session open onward. Most platforms use each bar’s typical price, which is the high plus the low plus the close divided by three. The calculation resets at the start of each new session.
Is VWAP better than a moving average?
They answer different questions. A simple moving average treats every period equally, while VWAP weights each price by its volume and anchors to the session open. For intraday futures and equities, many traders prefer VWAP because it is the benchmark large institutions measure their own fills against.
Does VWAP work on all timeframes?
VWAP is designed for intraday use and resets each session, so it is most meaningful on timeframes below one day. On daily or weekly charts a standard session VWAP resets too often to be useful, though anchored VWAP variants exist for longer horizons.
Do I need Level 2 data to use VWAP?
No. VWAP is built from trade price and trade volume, which come from a standard Level 1 feed. You only need Level 2 market depth for order book tools like the SuperDOM, not for VWAP.
Related reading
- How to use VWAP in a trading strategy — the practical follow-up: balance days, trend days and the bands
- What is order flow trading? — the bigger picture VWAP sits inside
- Best NinjaTrader order flow indicators — how VWAP fits alongside footprint, delta and profile tools
- Kaizen VWAP and its documentation
Ready to put VWAP on your charts? Kaizen VWAP gives you the session line, deviation bands and prior-session reference for NinjaTrader 8, or you can pick it up alongside the other core tools in the Essentials Pack. Compare everything on the pricing page.
Bundle & Save
Essentials Pack
Core order flow essentials
$249
$396
Save37%