Order flow trading strategies are built on one idea: at the prices that matter, read what buyers and sellers are actually doing, then let that read, not the candle pattern, decide the trade. Price tells you where the market went. Order flow tells you who pushed it there, who absorbed it, and whether the push has anything left. This guide walks through five strategies traders build on that information, what each one looks for, and which tools show it on NinjaTrader 8. It is a map of how these setups work, not a promise about how they perform.
If the underlying concepts are new, two short reads set up everything below: what order flow is and how to read order flow.
What Makes an Order Flow Strategy Different
A classic technical strategy waits for a pattern to complete on the chart. An order flow strategy waits for a pattern to complete in the auction. The difference matters because the same candle can hide opposite realities: a green bar driven by aggressive buying and a green bar driven by sellers simply stepping aside look identical on price and completely different on the footprint and delta.
Every setup below shares the same four-part skeleton:
- A level worth watching. A prior high or low, a point of control or value area edge, the initial balance, VWAP. Order flow is only meaningful where someone has a reason to defend a price.
- A read of the flow at that level. Is aggression pushing through, or being absorbed? Is delta confirming the move, or diverging from it?
- A confirmation from price. The flow tells you what is happening; price tells you whether it worked.
- A predefined risk. Where the read is wrong, and what that costs, decided before entry.
Keep that skeleton in mind. The five strategies are really five different ways of filling in step 2.
Strategy 1: Absorption at a Level
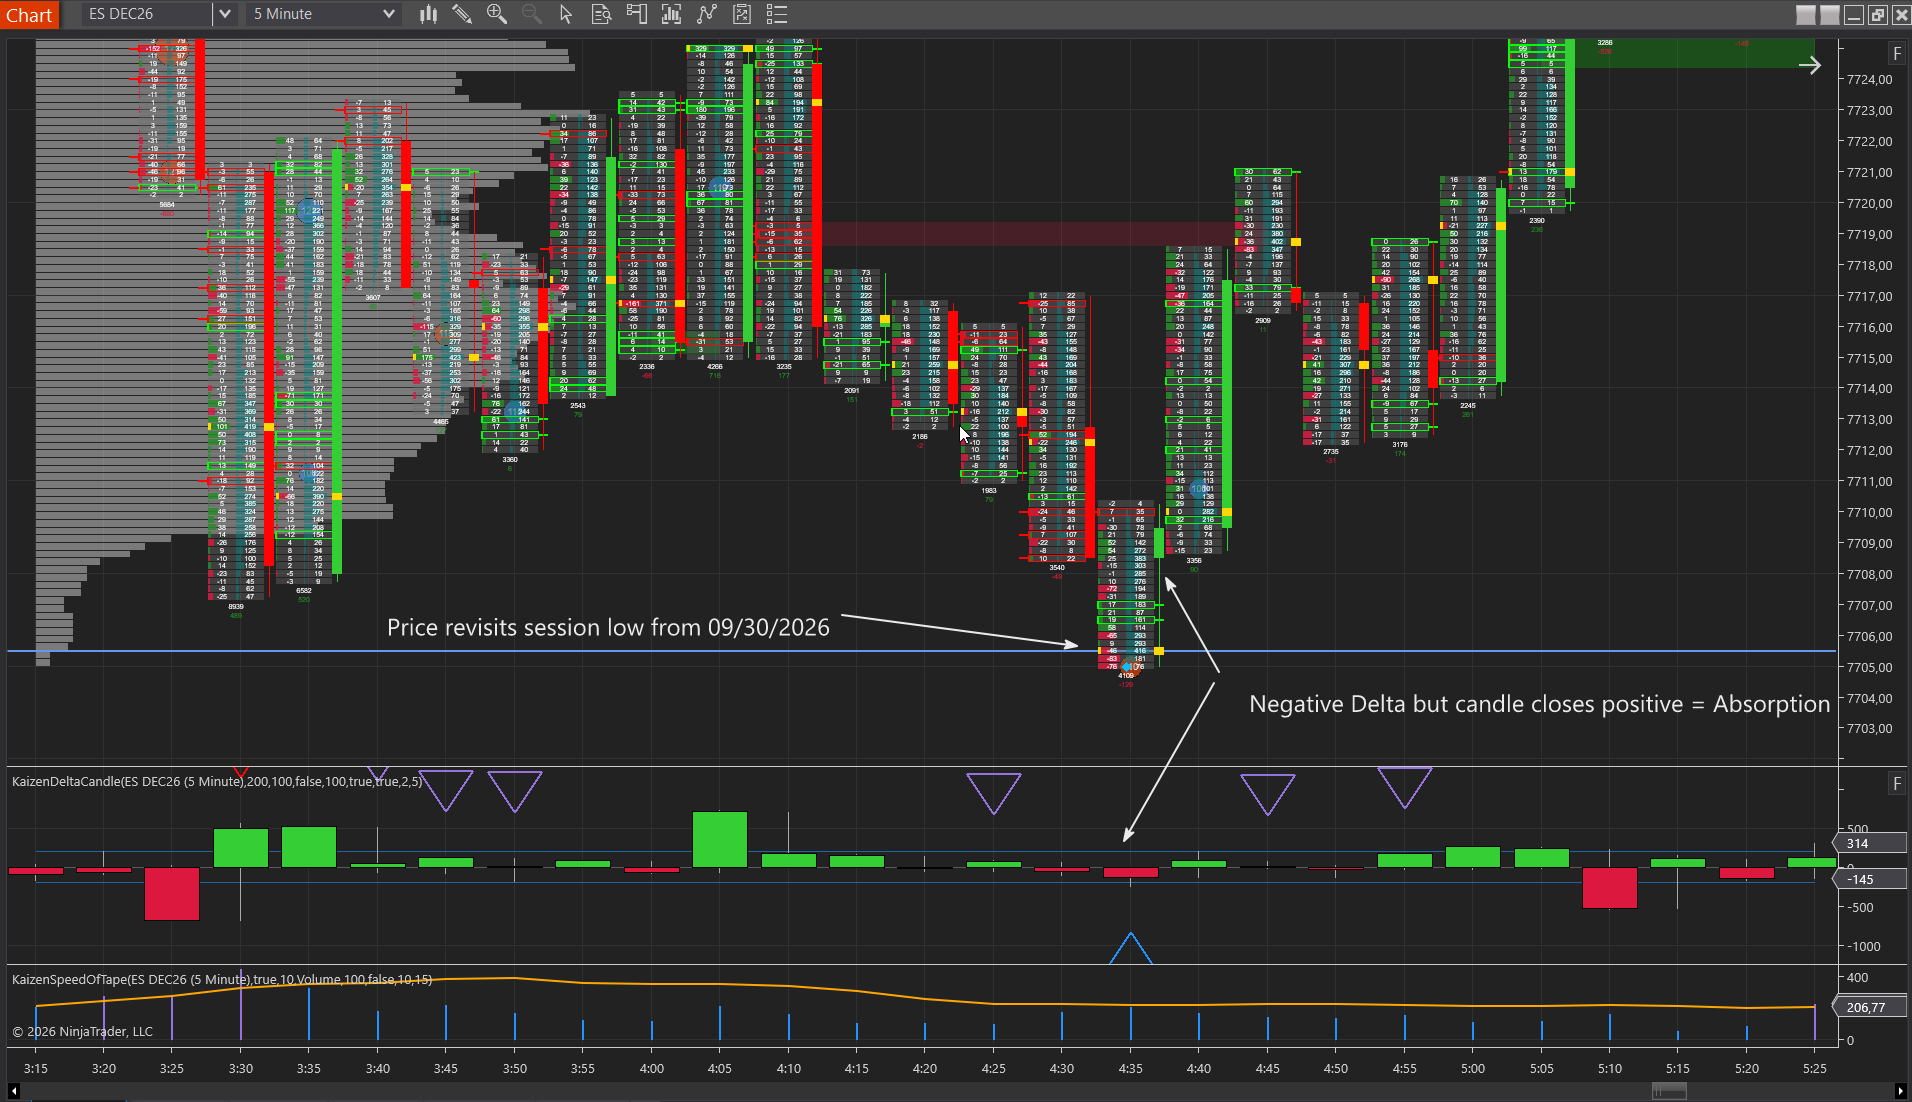
The idea. Aggressive orders keep hitting a price and it refuses to move, because a passive participant is absorbing them. Buyers lift the offer again and again at a prior high; the delta climbs; price goes nowhere. Someone large is selling into every lift. When the aggressive side finally gives up, price tends to move away from the level, often quickly, because the trapped aggressors have to get out.
What to look for. On the footprint, heavy volume at one price with the aggressive side dominant and no progress beyond it. On delta candles, a bar with strong delta in one direction that closes against it, a per-bar divergence that says the aggression lost. On Big Trades, a cluster of large prints at the same price while the candle stalls. All three describe the same thing from different angles; the more of them line up, the cleaner the read.
The trade logic. Traders wait for the aggression to fade and for price to confirm by moving away from the level, then trade in the direction of the absorbing side with risk placed beyond the absorbed price. The failure case is that absorption breaks: the passive side gets overwhelmed, the level gives way, and price accelerates through it. That is not a footnote, it is half of what happens, which is why the confirmation step exists. Absorption in trading covers the mechanics in depth, and iceberg orders explains how the passive side hides its size.
Strategy 2: Delta Divergence at an Extreme
The idea. Price makes a new high, but cumulative delta does not. The push is being carried by something other than fresh aggressive buying, sellers stepping aside, stops, short covering, and those sources run out. At a range extreme or the end of an extended move, that is a warning worth acting on once price agrees.
What to look for. On CVD, compare the current swing high to the prior one: price higher, cumulative delta lower. The divergence should form at a meaningful level, not mid-range, and within the same session, because cumulative delta resets at the open on most platforms. Bigger gaps between the two CVD highs are stronger than marginal ones.
The trade logic. The divergence itself is not the entry. Traders wait for price to fail: the new high does not hold, price closes back inside the prior range, or the small structure that carried the push breaks. Then they trade the failure with risk above the divergent high. Traders who fade every new high because delta lagged get run over by the ones that keep going, which is the single most common way this setup goes wrong. Our delta divergence guide covers the reading rules and mistakes in detail.
Strategy 3: Stacked Imbalance Continuation
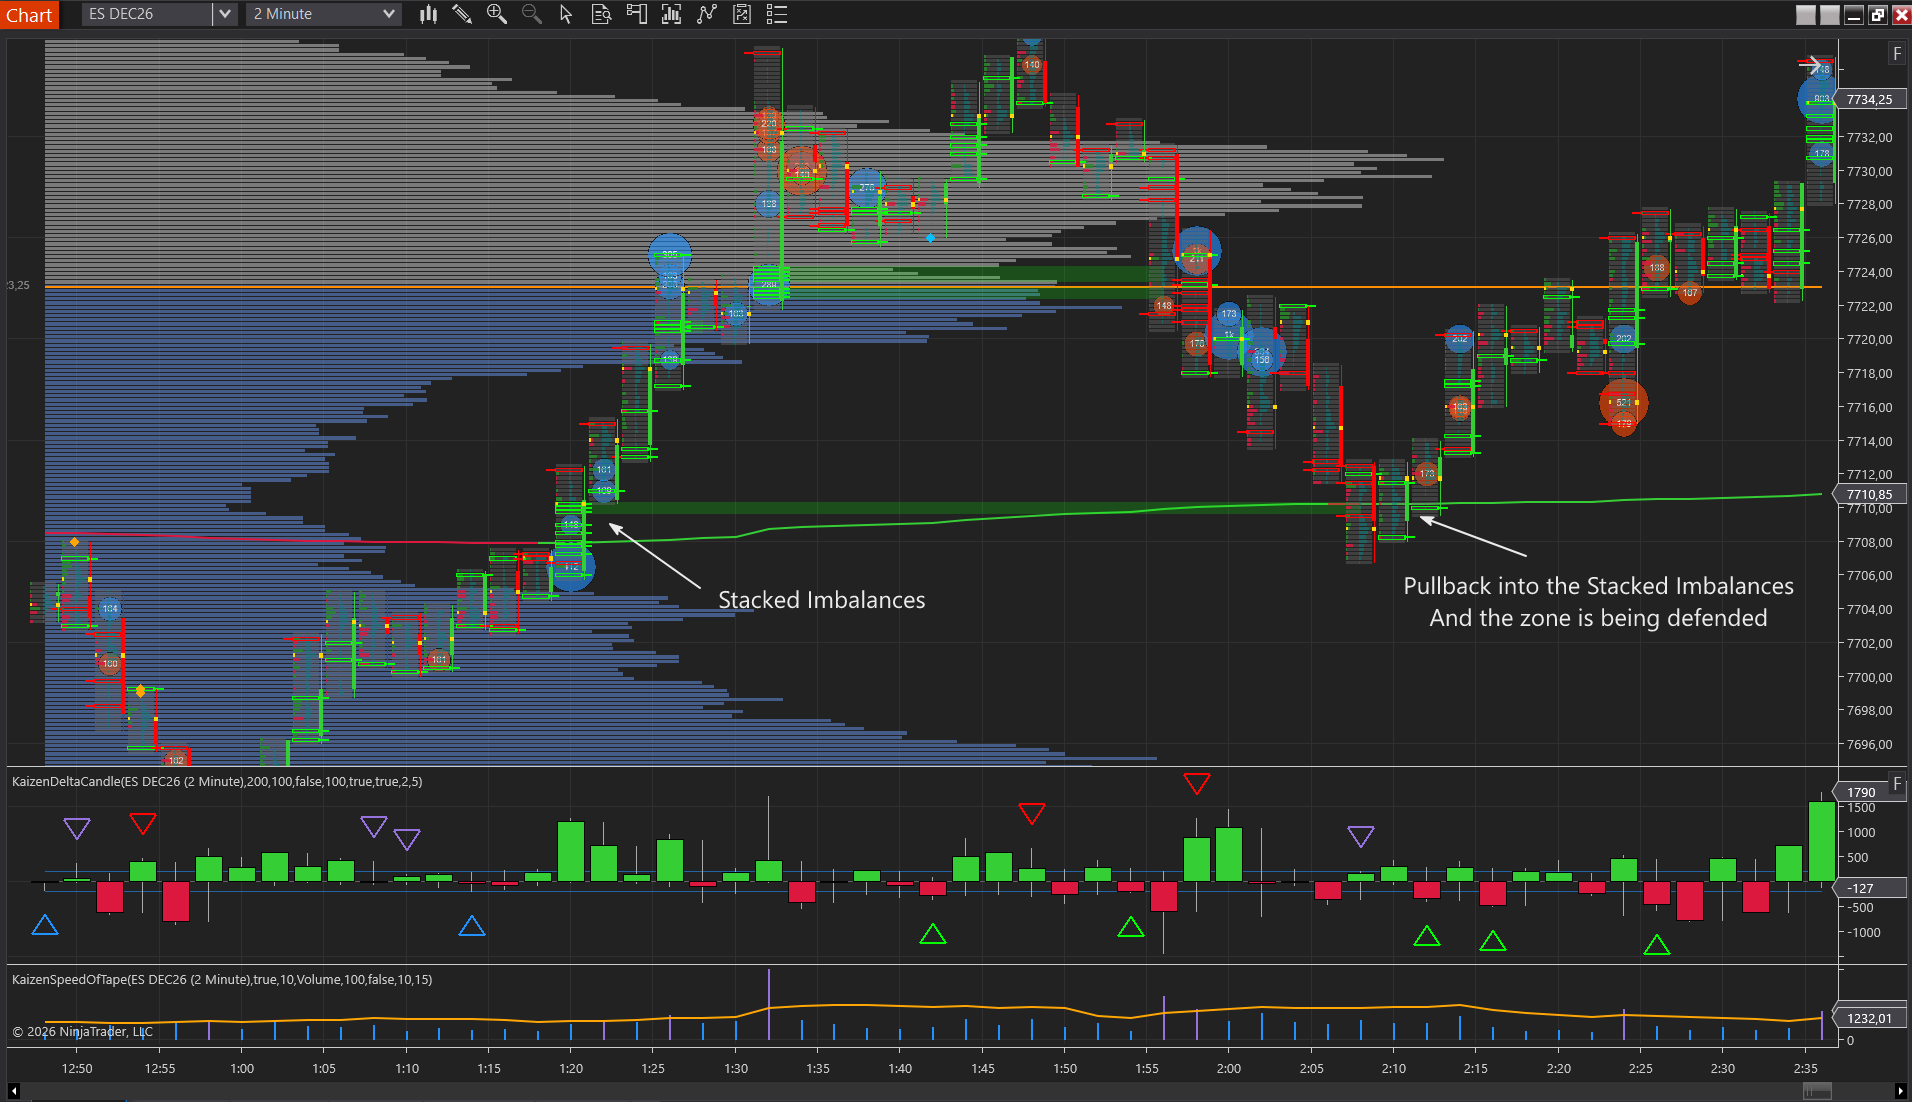
The idea. An imbalance on the footprint is a price where one side overwhelmingly dominated: far more volume traded at the ask than at the bid diagonally below it (buying imbalance), or the reverse (selling imbalance). A common default threshold is 300%, meaning three times the volume on one side. When several imbalances stack on consecutive price levels, three or more is a common minimum, it shows aggressive participants pushing through the level with force rather than trading around it. That is initiative, and initiative tends to continue.
What to look for. On the footprint, a run of consecutive imbalances in the same direction, ideally forming as price leaves a level or breaks a range. Kaizen Stacked Imbalance detects and marks these stacks automatically and keeps the zone on the chart, because the stack often acts as support or resistance when price pulls back to it.
The trade logic. There are two versions. The aggressive one is to trade in the direction of the stack as it forms, with risk below the stacked zone. The more patient one is to wait for price to pull back into the stacked zone and to see whether it holds, then trade the continuation with risk beyond the zone. Chasing a stack that has already run several points is the usual mistake; the pullback version exists to avoid it. Stacks fail, particularly when they form into a level where absorption is waiting, so the confirmation and risk steps still apply.
Kaizen Footprint
flagshipFull bid×ask footprint chart with imbalances, stacked zones & unfinished business
$249
Lifetime license
Strategy 4: Initial Balance and Opening Range Plays
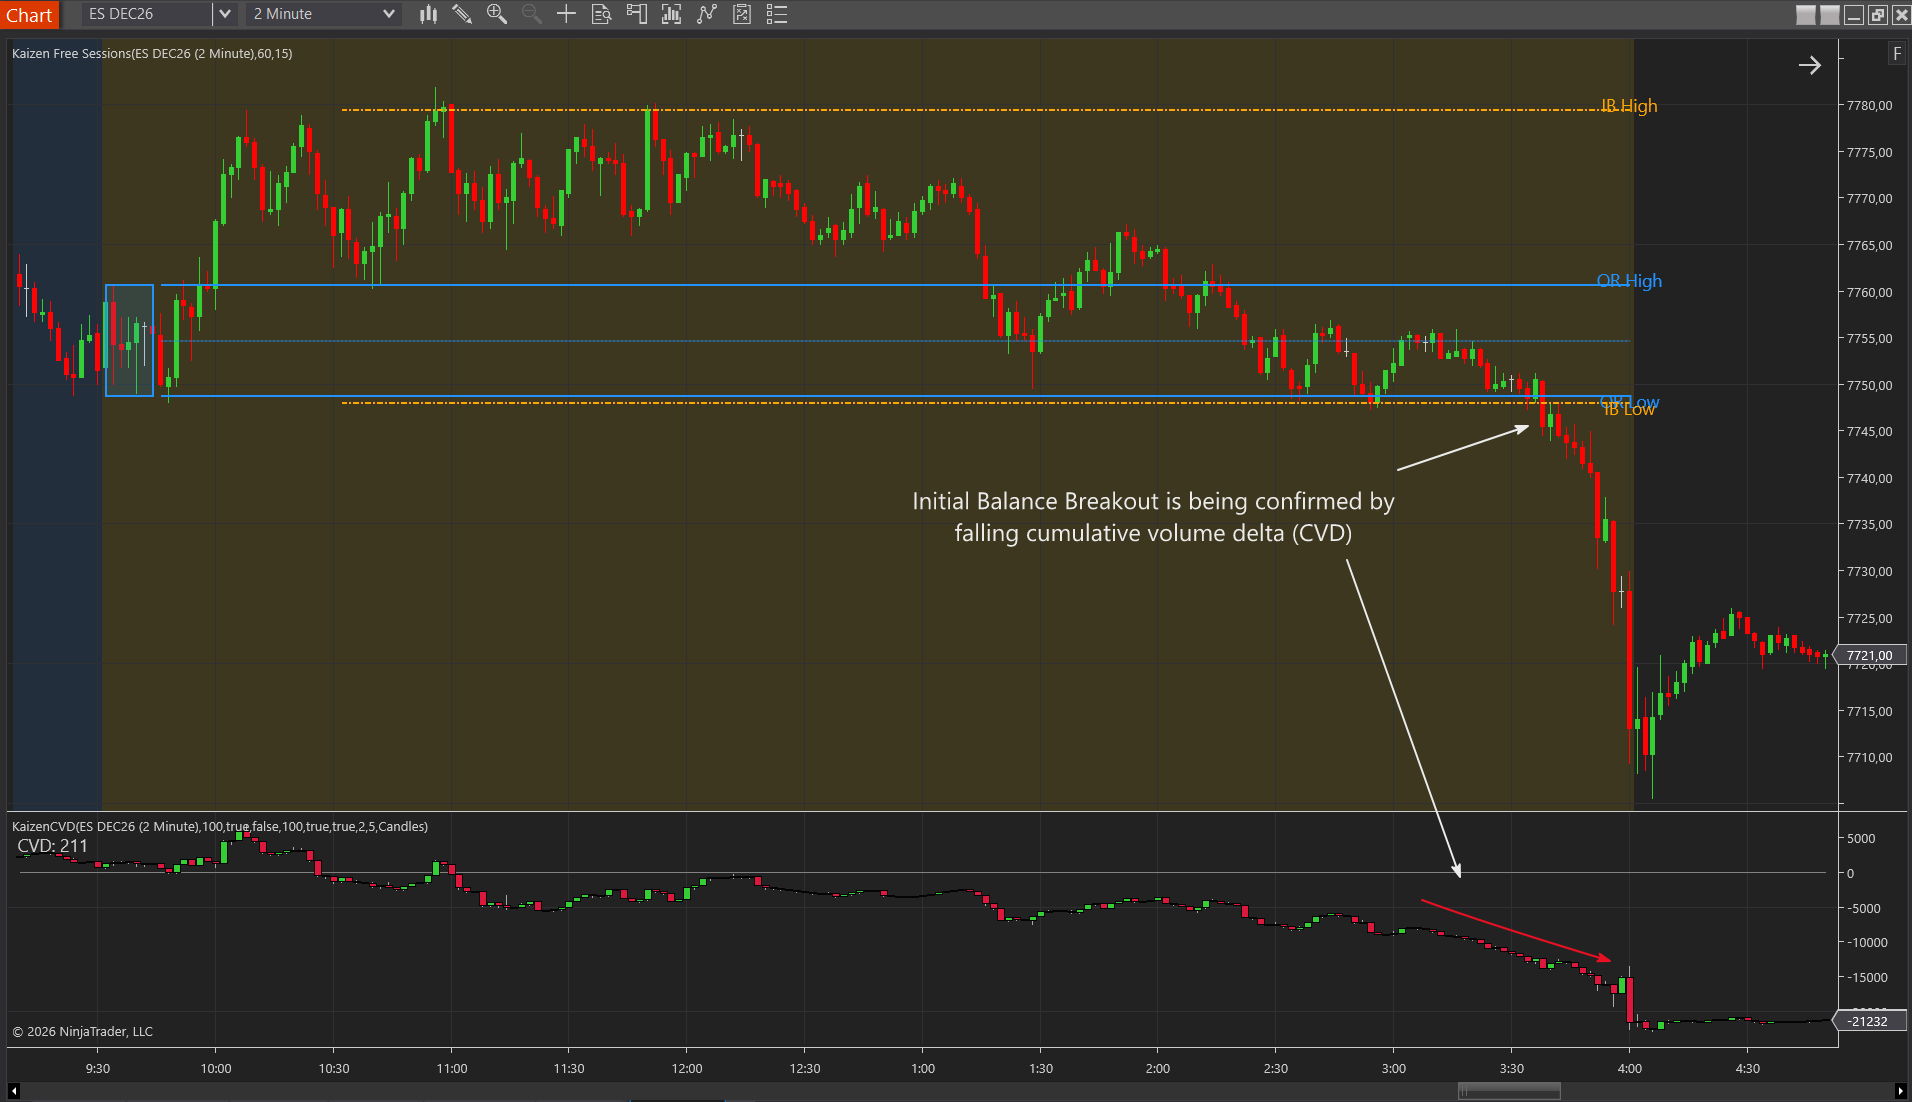
The idea. The initial balance is the high-low range of the first hour of the regular session; the opening range is the first few minutes, commonly five, fifteen or thirty. Both are the market’s opening attempt to define where today’s value will be. What happens at their edges, a break that holds, a break that fails, sets the tone for the session.
What to look for. As price approaches the initial balance high or low, read the flow: is the break driven by stacked imbalances and rising delta, or is it thin and absorbed? A break on strong, confirmed aggression suggests range extension. A break that gets absorbed and closes back inside suggests a failed breakout and a rotation back through the range. The free Kaizen Sessions indicator draws the initial balance and opening range with a breakout alert, and the TPO chart shows how the profile is building around them.
The trade logic. The two common plays are the initial balance breakout, trading in the direction of a confirmed break with risk back inside the range, and the failed breakout, trading back toward the opposite side of the range once a break is absorbed and price re-enters. Which one is on the table depends entirely on the flow at the edge, which is the whole point of reading it rather than assuming.
Strategy 5: VWAP with Order Flow Confirmation
The idea. VWAP is the session’s volume-weighted average price, the benchmark large participants measure their fills against, which is why price so often reacts to it. On a trend day, pullbacks to VWAP are where buyers and sellers argue about whether the trend continues. Order flow tells you who is winning that argument.
What to look for. On a pullback to VWAP in an uptrend, watch for aggressive selling into the line that gets absorbed and for delta that stays constructive. That is the flow saying the pullback is being bought. The opposite, selling that pushes cleanly through with confirming delta, says the trend is in trouble. How to use VWAP covers the trend-day and balanced-day distinction that decides which read applies.
The trade logic. Traders enter with the trend once the pullback to VWAP shows absorption and price turns, with risk beyond the absorbed area, and treat a clean, confirmed break of VWAP as a reason to stand aside or reassess. The mistake is buying every touch of the line regardless of what the flow says; VWAP is a location, and the flow is the reason.
Putting It Together
Notice that all five strategies are the same process wearing different clothes. Each one starts with a level, reads the aggression and absorption at that level, waits for price to confirm the read, and defines the risk before entry. The tools change, footprint here, cumulative delta there, and the level changes, but the skeleton does not.
That is worth internalizing, because it is the antidote to the most common order flow mistake: reacting to every interesting print. A stacked imbalance in the middle of nowhere, a divergence with no level behind it, absorption on a price nobody cares about, are all just noise. The level gives the flow its meaning.
Bundle & Save
Complete Bundle
All 21 tools at the best price
$599
$2789
Save79%
What Order Flow Strategies Are Not
They are not signals. None of these setups fires an entry; they describe a condition that makes a level worth trading, and the trade still needs confirmation and a risk. They are not a system, either. Two traders can read the same absorption and make different, defensible decisions. And they are only as good as the data feeding them: footprints and delta depend on tick-by-tick trades with bid and ask attached, so if your feed does not deliver that, the tools show something that looks like order flow and is not. Our guide to NinjaTrader order flow data feeds explains which feeds work.
A Realistic Word on Expectations
Order flow gives you a materially better view of the auction than price alone, and these strategies are the standard ways traders turn that view into decisions. But none of them guarantees an outcome. Absorption breaks, divergences persist, stacks fail, breakouts reverse, and the same setup that worked on ten sessions fails on the eleventh when the market’s character changes. Treat every one of these as a framework for where to pay attention and what to look for, confirm with price, define your risk before you act, and remember that past behavior does not guarantee future results. Everything here is educational and not financial advice. Practicing these reads on NinjaTrader’s Market Replay, where you can replay real sessions tick by tick, is the fastest and cheapest way to build the skill.
Frequently Asked Questions
What is an order flow trading strategy?
An order flow trading strategy is a plan for entering and managing trades based on what buyers and sellers are actually doing at specific prices, rather than on price patterns alone. It typically combines a level worth watching, a read of the aggression and absorption at that level from tools like the footprint and cumulative delta, a confirmation from price, and a predefined risk. The five setups in this guide all follow that skeleton.
What is the best order flow strategy for beginners?
There is no single best strategy, but the most learnable starting point is absorption at a clear level with one tool, such as watching a footprint or delta candles at a prior day’s high or low. It teaches the core skill, reading whether aggression is being absorbed or pushing through, without a lot of moving parts. Practice it on NinjaTrader’s Market Replay before risking capital.
Do order flow strategies work on all markets?
They work best on liquid, centrally cleared markets where every trade is reported with bid and ask information, which is why most order flow traders focus on index futures like ES and NQ during regular hours. Thin instruments and off-hours sessions produce noisy footprints and erratic delta that make the reads unreliable.
What tools do I need for order flow trading?
At minimum a footprint chart to see volume at bid and ask per price, a cumulative delta indicator to track net aggression over the session, and a volume or TPO profile to identify the levels. Big-trade and speed-of-tape tools add detail. All of them depend on a data feed that delivers tick-by-tick trades with bid/ask information; without that, the tools show wrong or empty data.
Can order flow strategies be automated?
The rules can be coded like any other rule set, and many traders test order flow ideas systematically. The hard part is that the discretionary read, judging context, level quality and confirmation, is difficult to encode fully, so an automated version usually captures a narrower slice of the idea. Anything automated needs the same testing and risk limits as any other system.
Want the tools these strategies run on? Kaizen Footprint, Kaizen CVD, Kaizen Big Trades, Kaizen Stacked Imbalance and Kaizen Volume Profile cover every read in this guide, and the free Sessions indicator draws the initial balance and opening range. The Complete Bundle includes all of them. Compare everything on the pricing page.