KaizenAnchoredVolumeProfile
KaizenAnchoredVolumeProfile is a drawing tool that builds a volume-by-price profile between two anchors, with POC, value area and a delta histogram for the chosen range.
Updated: August 1, 2026
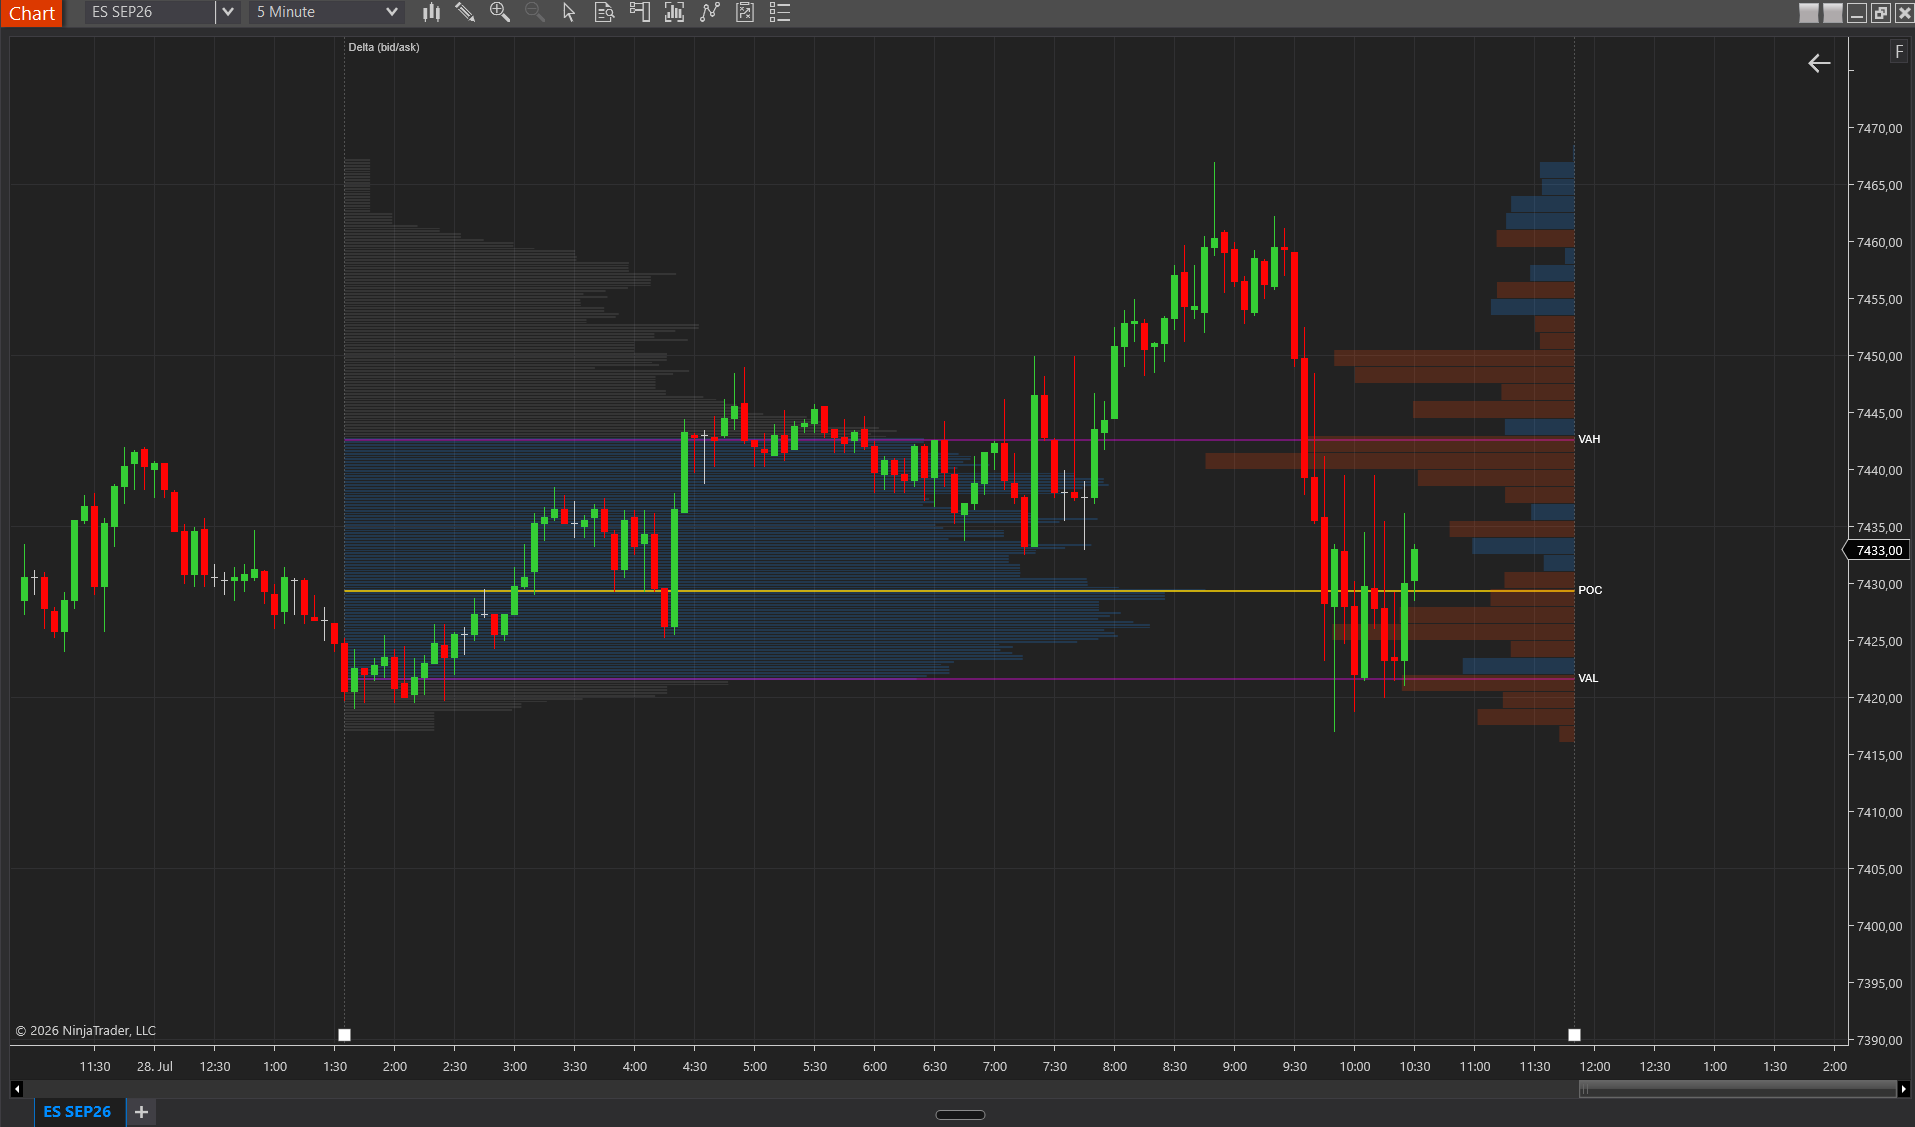
Drawing tool (not an indicator): place two anchors on the chart and the tool builds a Volume Profile between them. For each price level (grouped by tick size) it aggregates the volume of all bar high-low ranges that touch that level, then computes POC, VAH, VAL. The anchors can be dragged after placement; the profile recalculates with a 250 ms debounce.
Interpretation
- Anchored POC — usually the most reliable magnet level, it is where the market committed the most volume during the anchored period.
- VAH/VAL of an anchored range — define the “comfort zone” of that specific event (news release, session open, large breakout, etc.).
- Extend Zones — projects POC and VAH/VAL as horizontal lines to the right edge, turning an anchored profile into a live support/resistance reference.
- Ticks per Level and Value Area % — work identically to the session Volume Profile.
- Delta histogram (new in v2.2) — additionally shows who traded the volume at each level. A thick volume level with near-neutral delta is a genuine balance zone (both sides active); the same volume with heavily one-sided delta means one side unloaded or accumulated there. Especially telling when anchoring a single news impulse or a breakout bar.
Delta histogram (new in v2.2)
With Show Delta Histogram, the tool renders the bid/ask delta per price level in addition to the volume histogram: buys in one color, sells in the opposite one.
Mirrored since v2.3. The delta grows to the left from the same axis the volume profile grows right from, exactly like the main KaizenVolumeProfile indicator. Up to v2.2 it sat right-aligned inside the region, which was neither a mirror nor what the main indicator does.
The tick data for the anchored period is loaded asynchronously (BarsRequest). Right after placing or moving the anchors the delta histogram therefore appears with a short delay, the volume profile itself is available immediately.
If the feed has no bid/ask history for the requested period, the calculation automatically falls back to an uptick/downtick classification (slightly coarser, but available).
Anchor the period tightly around the event you care about (the news bar, the breakout, the opening auction). Over very long periods the delta averages itself out and the histogram loses its informative value.
Settings
1. Calculation
- Ticks per Level — Row aggregation. 1 = each tick is a row. Higher (4–5) for cleaner profiles over wide ranges.
- Value Area % — VA percentage. Default 68 (≈1σ).
2. Colors
- Profile Color — Histogram bars inside the VA. Default DodgerBlue.
- Outside VA Color — Bars outside the VA. Default Gray.
- POC Color — POC line. Default Gold.
- VAH/VAL Color — Value Area boundary lines. Default Magenta.
3. Display
- Opacity % — Histogram transparency. Default 20.
- Max Width % — Maximum histogram width as a % of the distance between anchors. Default 70. Lower it if the profile pushes the VAH/VAL labels off-screen.
- Show Labels — POC/VAH/VAL price labels.
4. Delta Histogram (new in v2.2)
- Show Delta Histogram — Renders bid/ask delta bars mirrored to the left from the profile axis (since v2.3; right-aligned up to v2.2). Loads tick data asynchronously; falls back to uptick/downtick classification when the feed has no bid/ask history. Default off.
- Delta Width % — Width of the delta bars as a % of the anchored region. Default 30.
- Delta Ticks Per Level — Row aggregation of the delta histogram (settable independently of the volume histogram). Default 1.
- Delta Buy Color — Color of buy-side delta. Default DodgerBlue.
- Delta Sell Color — Color of sell-side delta. Default OrangeRed.