KaizenDeltaCandle
KaizenDeltaCandle shows each bar's delta as an OHLC candle in its own panel and flags absorption when heavy one-sided volume fails to move price. Settings and a reading guide.
Updated: July 1, 2026
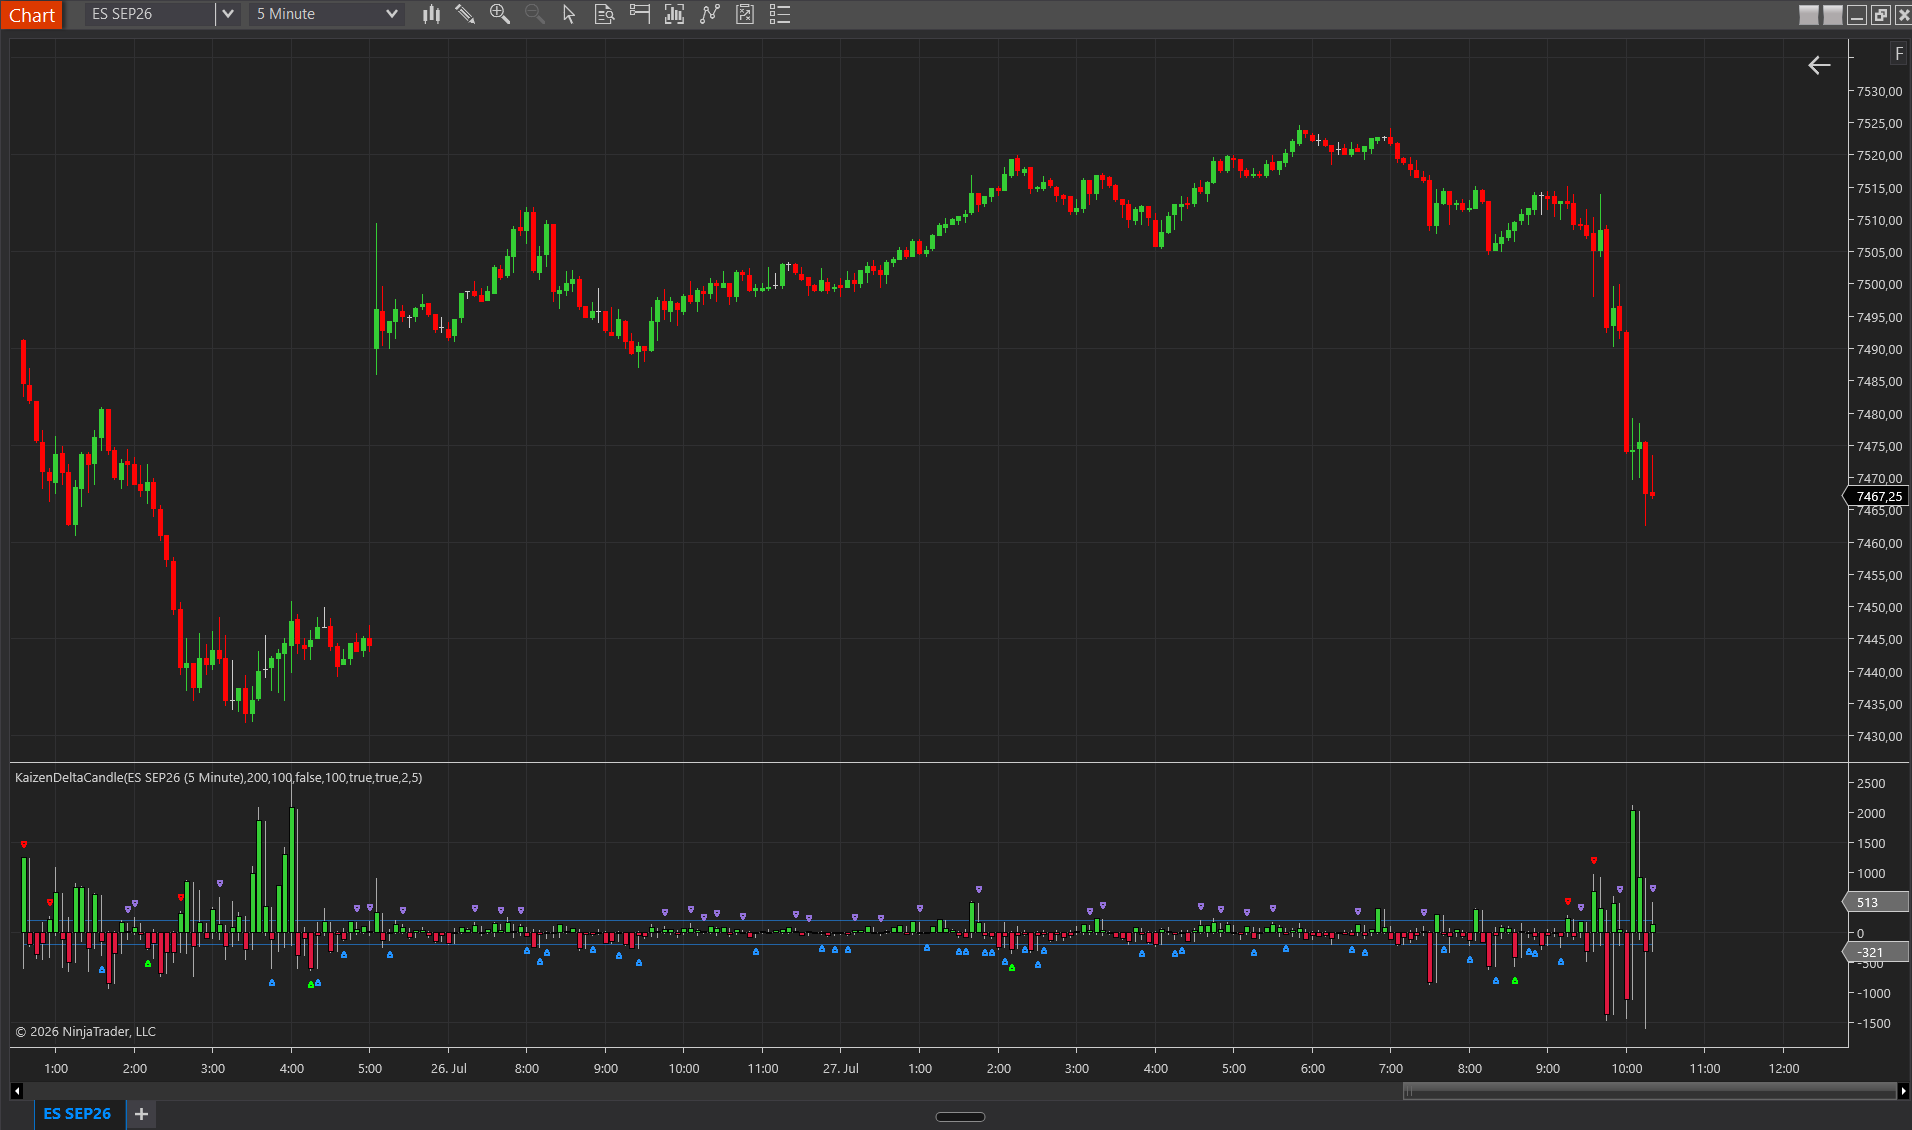
KaizenDeltaCandle visualizes the per-bar delta as OHLC candles in a separate panel. Unlike the CVD, which accumulates across the session, the delta candle resets to 0 at each new bar, so each candle represents the delta evolution of that individual bar. Open is always 0; high and low are the intra-bar delta extremes; close is the bar’s final net delta. The indicator also detects absorption arrows: contradictions between price direction and delta direction that usually mark exhaustion.
Interpretation
- Green candle (close > 0) = that bar closed net-bullish (more ask-side than bid-side volume).
- Red candle (close < 0) = the bar closed net-bearish.
- Long wicks on a small body = the delta reversed sharply mid-bar (for example, strong buying at first and then sellers took control to a flat close). Reveals loss of intra-bar conviction.
- Strong bearish absorption arrow = price rose but the delta was strongly negative; buyers absorbed the aggressive sellers. A sign of buying strength despite a green price bar.
- Strong bullish absorption = price fell but the delta was strongly positive; sellers absorbed the buyers. A sign of selling weakness despite a red price bar.
- Weak vs. strong absorption = strength is based on the magnitude of the absolute delta vs. the threshold.
Delta classification
Uses strict ATAS-style rules: trades are counted only when price reaches or crosses the bid/ask. Trades strictly between the spread are ignored, unlike the CVD, which uses last-price uptick/downtick for between-spread trades. This is more selective and avoids classification ambiguity.
Settings
Colors
- Positive Delta Color — candle fill when close ≥ 0. Default LimeGreen.
- Negative Delta Color — candle fill when close < 0. Default Crimson.
- Border Color — candle outline. Default Black.
- Wick Color — high/low wick lines. Default DarkGray.
Visuals
- Candle Opacity % — body transparency 0–100. Default 100. Wicks and absorption arrows are unaffected.
Absorption
- Show Absorption Arrows — master toggle for the arrows. Turn it off if you do not trade absorption setups.
- Show Weak Absorption — additionally renders weak-signal arrows (absolute delta between 0 and the threshold). Off = only strong absorptions.
- Absorption Threshold — minimum absolute delta magnitude for a strong absorption. Default 200. Lower = more arrows; higher = only high-conviction signals. Set 0 to disable all absorption detection.
- Absorption Up Color — arrow color for bullish absorption (negative delta + rising price). Default Lime.
- Absorption Down Color — arrow color for bearish absorption (positive delta + falling price). Default Red.
- Weak Absorption Up / Down Color — arrow colors for the weak signals. Only visible if Show Weak Absorption is active.
- Threshold Line Color — color of the +/- threshold reference lines drawn in the panel.
Divergence
The same pivot logic as in KaizenCVD, but computed against the per-bar delta instead of the cumulative delta. Bearish: price makes a higher high, the bar delta a lower high. Bullish: price makes a lower low, the bar delta a higher low. Because the bar delta resets to 0 on every bar, these divergences are shorter-term and more reactive than the CVD’s, useful for fine timing while the CVD supplies the structural context.
- Highlight Divergences — master switch for divergence detection. Default off.
- Swing Lookback (bars) — bars to the left AND right of a bar required to confirm it as a pivot. Default 5.
- Swing Line Width — stroke width of the divergence lines. Default 2.
- Max Lookback (bars) — maximum bar distance between two connected pivots. Default 100.
- Bullish Divergence Color — color of bullish divergence lines. Default Cyan.
- Bearish Divergence Color — color of bearish divergence lines. Default Magenta.
Fixed in v2.2: scrolling back more than ~256 bars flat-lined the delta candles (the panel scaling collapsed), which made the divergence lines appear to float in empty space. Full history now draws correctly.
Requirements
For accurate history, Tick Replay must be enabled (see Installation and getting started).