KaizenClusterSearch
KaizenClusterSearch finds high-volume price clusters inside each completed bar, marks them on the chart and projects untested cluster levels forward as support or resistance.
Updated: July 1, 2026
KaizenClusterSearch detects high-volume price clusters within each completed bar. Volume is summed per price level (levels grouped by Ticks Per Level), and levels that pass a detection rule are marked as clusters, either as a single box marker at the central price or as an extended dashed line that projects forward until price touches it. Two detection modes let you choose the selection rule: the absolute one (pick the highest-volume level) or the relative one (pick every level above X% of the average per-level volume).
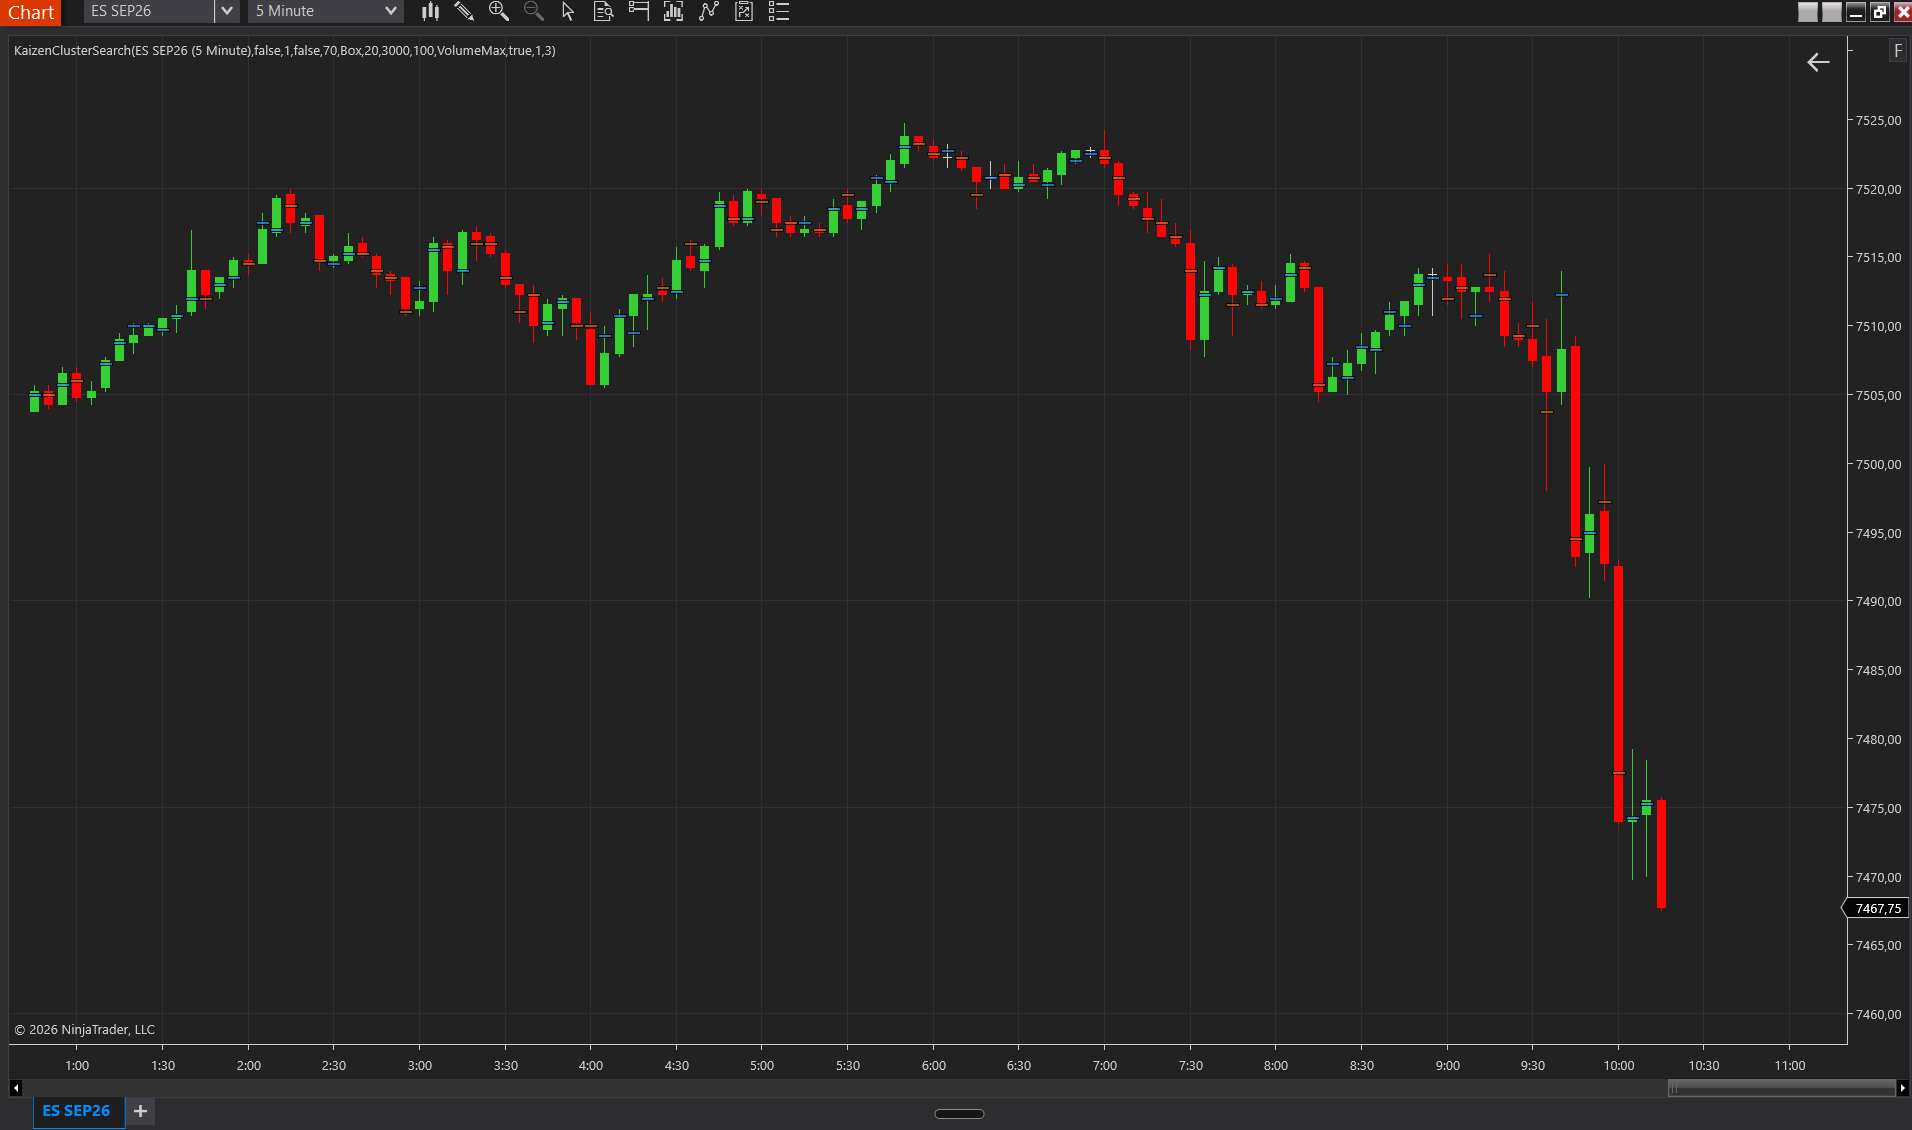
Interpretation
- Cluster on a bullish bar = buyers absorbed at that specific price (potential demand).
- Cluster on a bearish bar = sellers absorbed (potential supply). The indicator color-codes bullish-bar vs. bearish-bar clusters.
- Unfinished extended levels act as magnets: untested clusters are often revisited before a trend continues.
VolumeMax vs. VolumeRelative
- VolumeMax picks only the single highest-volume level per bar: simple, strong, no clutter.
- VolumeRelative picks every level above a % threshold of the bar’s average per-level volume: more granular, more clusters per bar.
Ticks Per Level trade-off: a smaller value reveals fine structure but creates noise; a larger value aggregates ticks and produces cleaner, stronger clusters.
Settings
Logic
- Cluster Search Mode — VolumeMax = single highest-volume level per bar. VolumeRelative = every level above a % threshold (more clusters, more detail).
- Volume Multiplier — VolumeRelative only: threshold = average per-level volume × multiplier. Default 3.0 (3× the average). Lower (1.5) = more clusters; higher (5.0) = only extreme concentrations.
- Min. Absolute Volume — hard floor; any cluster must have ≥ this volume to render, regardless of mode. Default 200. Set it to 5–10% of typical bar volume for a reasonable noise filter.
- Ticks Per Level — aggregates ticks into price levels. 1 = each tick is its own level. 4 on ES = 1-point rows. Higher values reduce noise and memory; lower values show microstructure.
- Max Clusters Per Bar — cap of markers per bar, VolumeRelative only. Default 20. If more levels pass the threshold, only the top N by volume are rendered. VolumeMax ignores it.
Visuals
- Marker Style — Box / Diamond / WideLineMarker; purely visual.
- Marker Opacity % — transparency 0–100. Default 70.
- Behind Bars — if active, clusters are rendered behind the candles (subordinate). Default off (in front).
- Extend Unfinished — each cluster projects forward as a horizontal dashed line until price touches it within half a level width. Useful for identifying unconfirmed levels. Default off.
- Extend Line Width — stroke thickness 1–5 of the extended dashed lines.
Colors
- Positive Bar Color — cluster color when the source bar is bullish (close > open). Default DodgerBlue.
- Negative Bar Color — cluster color when the source bar is bearish. Default Chocolate.
- Extended Line Color — color of the dashed extension. Default Gold.
Data / Performance
- Show Tick Replay Warning — message on the chart if Tick Replay is off (required for accurate historical per-level volume).
- Max Stored Bars — history limit. Default 3000.
Requirements
For accurate history, Tick Replay must be enabled (see Installation and getting started).