KaizenVolumeProfile
KaizenVolumeProfile builds a volume-by-price histogram for a session, day, week, visible window or custom range, with POC, value area and naked levels. Full settings guide.
Updated: August 1, 2026
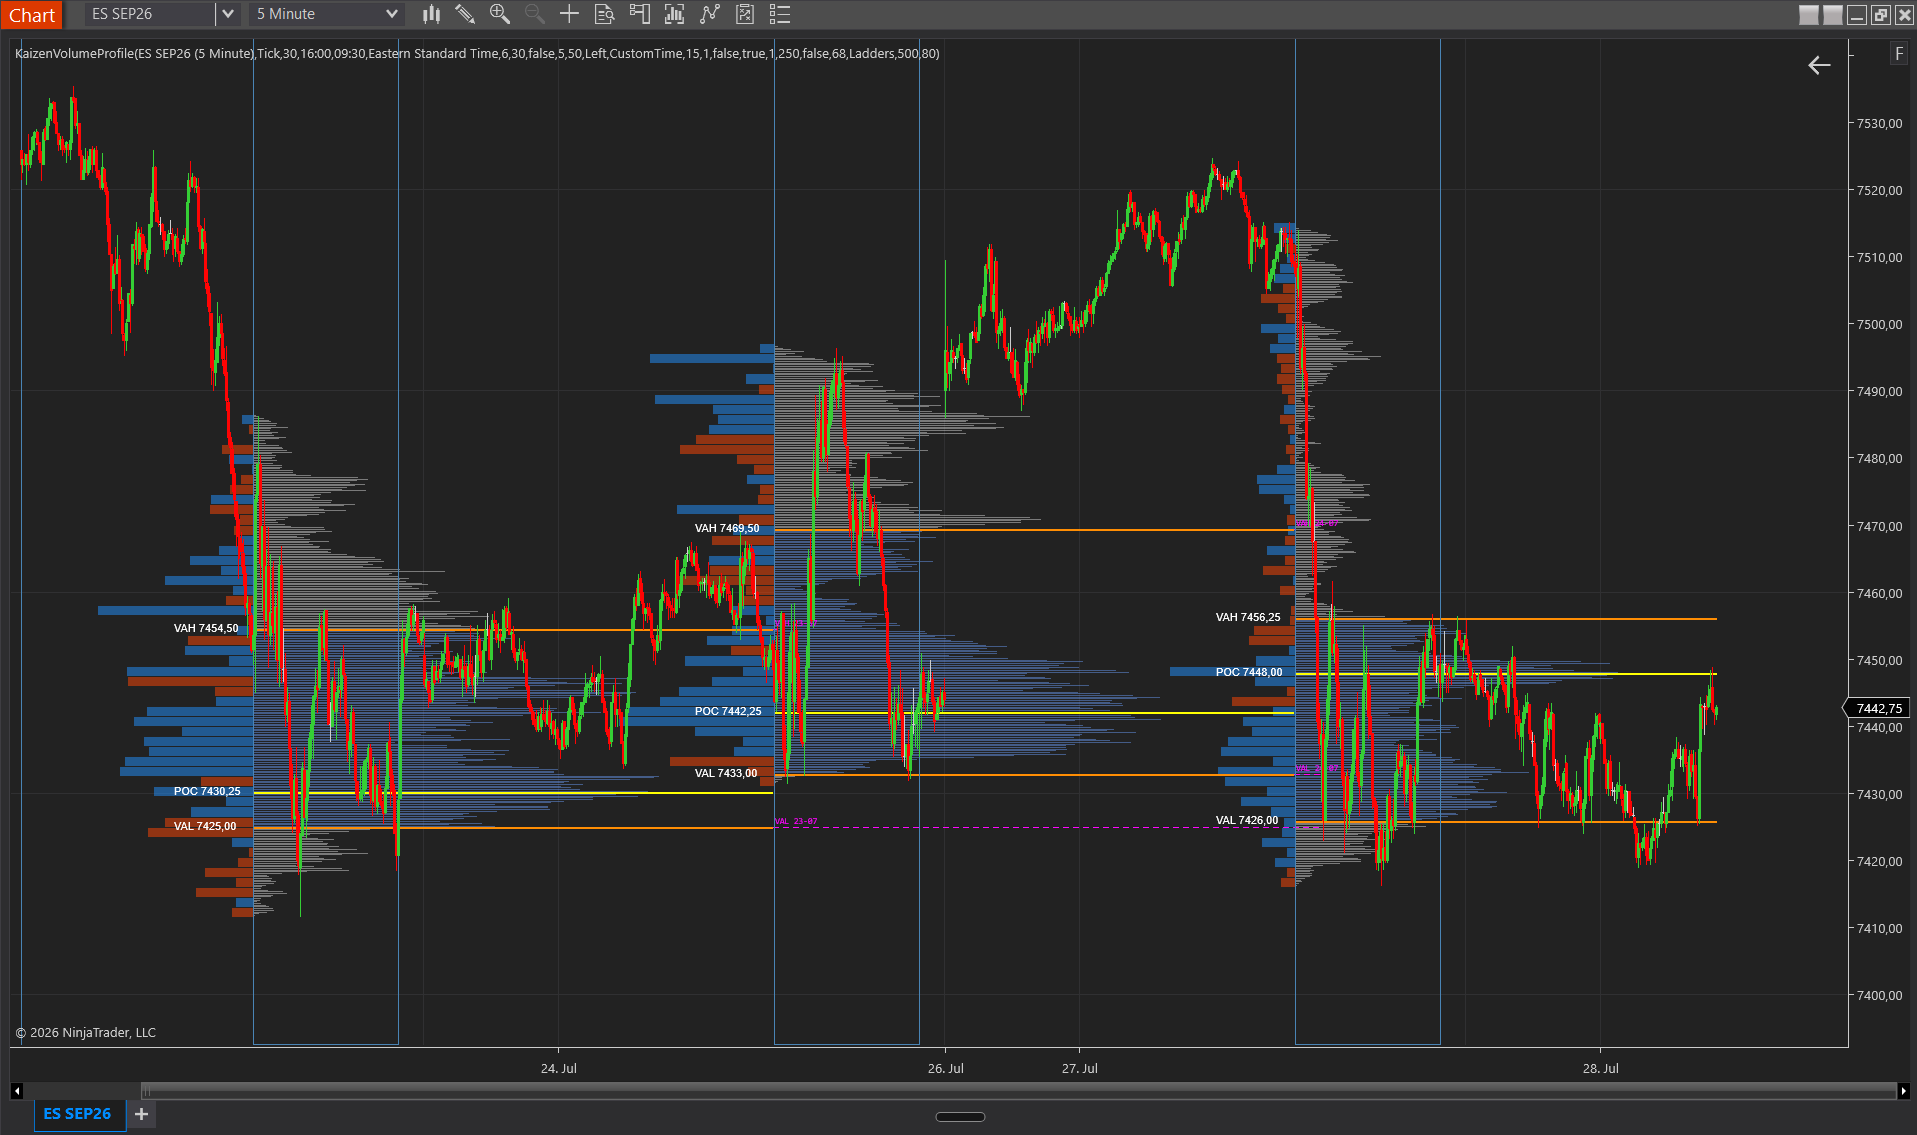
KaizenVolumeProfile builds a volume-by-price histogram next to the bars, showing how many contracts changed hands at each price level during a session, day, week, visible window or custom time range. For each profile the engine computes the Point of Control (POC), the single price level with the most volume, and the Value Area (VAH/VAL), the narrowest price range that contains a configurable percentage (68% by default) of the total volume. Consecutive profiles with similar Value Areas can merge automatically into a composite that reveals multi-session balance zones.
Interpretation
- POC as a magnet — the market traded more contracts here than anywhere else; it is the period’s consensus “fair price”. When price moves away from the POC, it tends to return, especially within the same session.
- Value Area as a comfort zone — 68% of the volume occurred between VAL and VAH. Inside the VA = normal auction. Outside = the market is exploring or rejecting; out-and-back-inside is a classic mean-reversion setup.
- Naked levels as acceptance gaps — price levels inside or adjacent to the VA that had zero volume. They tend to act as magnets because the market left them “unfinished” and tends to fill the gap.
- Composite merging reveals multi-day structure — when Monday’s and Tuesday’s sessions accept roughly the same range, the profiles merge into a taller, wider histogram that marks a zone of institutional consensus.
- Profile width = type of day — a narrow, tall profile indicates a trend or directional day; a wide, flat profile indicates a balance or range day. The shape is often visible before the session close.
Composite Mode (how similarity is measured)
Two profiles merge if both conditions are met:
- Their VAH and VAL differ by less than the Composite Tolerance % of the average VA range.
- Their value areas overlap by at least 50%.
Example with 30% tolerance: Monday VAH=5100, VAL=5060 (range 40); Tuesday VAH=5110, VAL=5065 (range 45). Average range = 42.5, tolerance window = 12.75. VAH drift = 10 and VAL drift = 5, both within tolerance, and the profiles overlap more than 50%, so they merge.
Use 10–15% for strict merging (only nearly identical sessions) and 40–50% for flexible merging that groups broader balance phases. By default 30% is a good starting point for most liquid futures.
Settings
Profile
- Profile Mode — defines the time boundary that resets the profile. Session = resets at the exchange session open (standard for RTH traders). Daily = resets at midnight. Weekly = one profile per trading week. VisibleWindow = the profile always covers the currently visible bars and recalculates on pan/zoom. CustomTime = only accumulates between the configured start/end times (for example only RTH on a 24h future).
- Week Starts — (new in v2.3, Weekly only) CalendarMonday (default) starts the week on Monday 00:00. SessionOpen puts the Sunday evening session into the new week instead of leaving it in the old one.
- Accuracy Mode — Minute (default) creates a secondary 1-minute series and distributes each bar’s volume across the minute-level prices it touched, revealing intra-bar structure. Tick is more precise but requires Tick Replay in historical mode; the engine warns if Tick Replay is off. Off treats each bar as a single price point (coarser, no intrabar detail).
- Ticks Per Level — row aggregation. 1 = each tick is its own row (maximum detail, dense over wide ranges). 4 on ES = 1 row per whole point. Higher values compress the histogram and reduce memory; lower values show microstructure.
- Value Area % — percentage of total volume that defines the VA. Default 68 (≈ 1 standard deviation in a normal distribution). 70 is Steidlmayer’s original convention. 75+ gives a wider, more tolerant VA.
- Custom Start Time — CustomTime only: profile start HH:mm (for example 09:30).
- Custom End Time — CustomTime only: profile end HH:mm (for example 16:00). From v2.3 the window is evaluated as (start, end]: the bar stamped with the start time still belongs to the previous period and drops out, and the bar stamped with the end time belongs to the window. NinjaTrader stamps bars with their closing time, so previously a premarket bar slipped in at the front and the closing bar fell out at the back.
- Custom Time Zone — CustomTime only: Windows time-zone ID. Default Eastern Standard Time, which handles daylight saving automatically.
- Enable Composite Mode — when enabled, consecutive profiles that pass the similarity test merge into a wider composite. Default off.
- Composite Tolerance % — maximum % of the average VA range by which VAH/VAL may differ before two profiles are considered distinct. Default 30. Lower = stricter, more individual profiles; higher = more flexible, more composites.
Visuals
- Position — profile rendered to the left or right of the price bars.
- View Style — Ladders = stepped histogram (each row is a solid bar). Area = continuous shape, visually smoother, good for composites spanning many rows.
- Width % — maximum histogram width as a % of the distance between bars. Higher = wider, visually dominant; lower = compact.
- Opacity % — histogram transparency 0–100. Low values (15–30) let the candles show through the histogram.
- Show Profile — master toggle for the histogram bars. Off = only POC/VAH/VAL/Naked Levels are rendered (useful for a clean support-and-resistance reference).
- Show POC — horizontal line at the highest-volume price.
- Show Value Area — shades or draws lines between VAL and VAH.
- Show Labels — price labels next to POC/VAH/VAL.
- Show Naked Levels — horizontal rays from untested VAH/VAL/POC of prior sessions, which act as magnets until price reaches them.
- Show Delta Histogram — (new in v2.0) renders a second histogram next to the volume one showing the aggressive delta per price level: buy delta (aggressive buys) in one color and sell delta (aggressive sells) in another. Identifies zones where buying or selling pressure dominated, which the flat volume histogram does not show. Especially useful in multi-day composites to spot institutional absorption zones.
- Show AMT Class — (new in v2.3) shows the Dalton opening type (OAR/OAV/OIV/OBV/OBR) above the profile. Always computed from the 09:30–16:00 ET RTH session against yesterday’s range and value area, independent of the chart’s trading hours and of the profile mode. An ETH chart therefore still shows the RTH class, and the value always matches KaizenTPO and KaizenStatsProfile. Intended for US index futures (ES/NQ/YM/RTY): on instruments with a different primary session (GC, FDAX) the label is computed over a window that has no special meaning there.
Low Volume Nodes (LVN) (new in v2.3)
A low volume node (LVN) is a narrow price area the market traded through without building volume there — a rejection zone between two areas of acceptance. When price returns later it usually crosses such zones quickly; stalling inside one is a change of behavior and worth a second look.
Detection looks for a real valley between two peaks: an area only counts if it is below the Node Threshold and flanked on both sides by clearly heavier areas. A pure threshold would count the thin tails of every profile — those are value-area edges, not nodes.
- Show LVN — master switch. Default off. Detected nodes are drawn as a band extending right until price trades back into it.
- Bin Size (ticks) — aggregation before detection. Default 4 (1 point on ES). Below 4 the detector starts reporting tick noise; a node must be at least 2 bins wide.
- Node Threshold (% of POC) — a bin counts as thin below this share of the POC bin’s volume. Default 25. Higher = more and wider nodes.
- Flank Threshold (% of POC) — absolute floor for the peaks on both sides. Default 35. Keeps the profile’s thin tails out.
- Max Nodes per Profile — cap on reported nodes per profile. Default 3 — the most pronounced first.
- LVN Opacity % — transparency of the bands. Default 25.
Session Highlight (new in v2.0)
Visually highlights on the chart the time range that is feeding the profile calculation. Designed mainly for CustomTime mode (for example when you set 09:30–16:00 ET on a 24h future so the VP is computed only from RTH), but it also works in the other modes.
- Show Session Background — when enabled, shades all bars within the configured time range with a semi-transparent color. You see at a glance which segment of the chart is entering the calculation.
- Show Session Box — when enabled, draws a bordered box around the same time range. Useful if you want a clear marker without the colored background, or as a complement to the background.
Colors
- VA Color — histogram rows inside the Value Area.
- Non-VA Color — rows outside the VA, usually a dimmer or gray tone.
- Text Color — price labels.
- POC Color — POC line. Gold by default for high contrast.
- VAH/VAL Color — Value Area boundary lines.
- Naked Level Color — rays of untested prior levels.
- Buy Delta Color — (new in v2.0) color of the delta-histogram rows with dominant buying pressure.
- Sell Delta Color — (new in v2.0) color of the delta-histogram rows with dominant selling pressure.
- Session Background Color — (new in v2.0) color and transparency of the session shading (when Show Session Background is enabled).
- Session Box Color — (new in v2.0) border color of the session box (when Show Session Box is enabled).
- LVN Color — (new in v2.3) color of the LVN bands. Default Gold.
Performance
- Max Lookback Profiles — number of completed profiles kept on the chart. Default 5. Older profiles are discarded when the limit is exceeded. Raise it for multi-week context, lower it to save memory on RAM-limited machines.
- Update Interval (ms) — throttle for live profile redraws. Default 250 ms. On fast instruments (ES/NQ) raise it to 500+ if you see stutter; lower it to 100 for very reactive low-volume symbols.
- Visible Window Debounce (ms) — VisibleWindow mode only: delay before recalculating after a pan/zoom, so continuous scrolling does not trigger constant recalculations.
Requirements
For accurate history in the Tick Accuracy mode, Tick Replay must be enabled (see Installation and getting started).