KaizenSpeedOfTape
KaizenSpeedOfTape measures how fast the tape is printing: it sums volume, ticks, buys, sells or delta over a 1-300 second window and plots a histogram with signal lines.
Updated: July 1, 2026
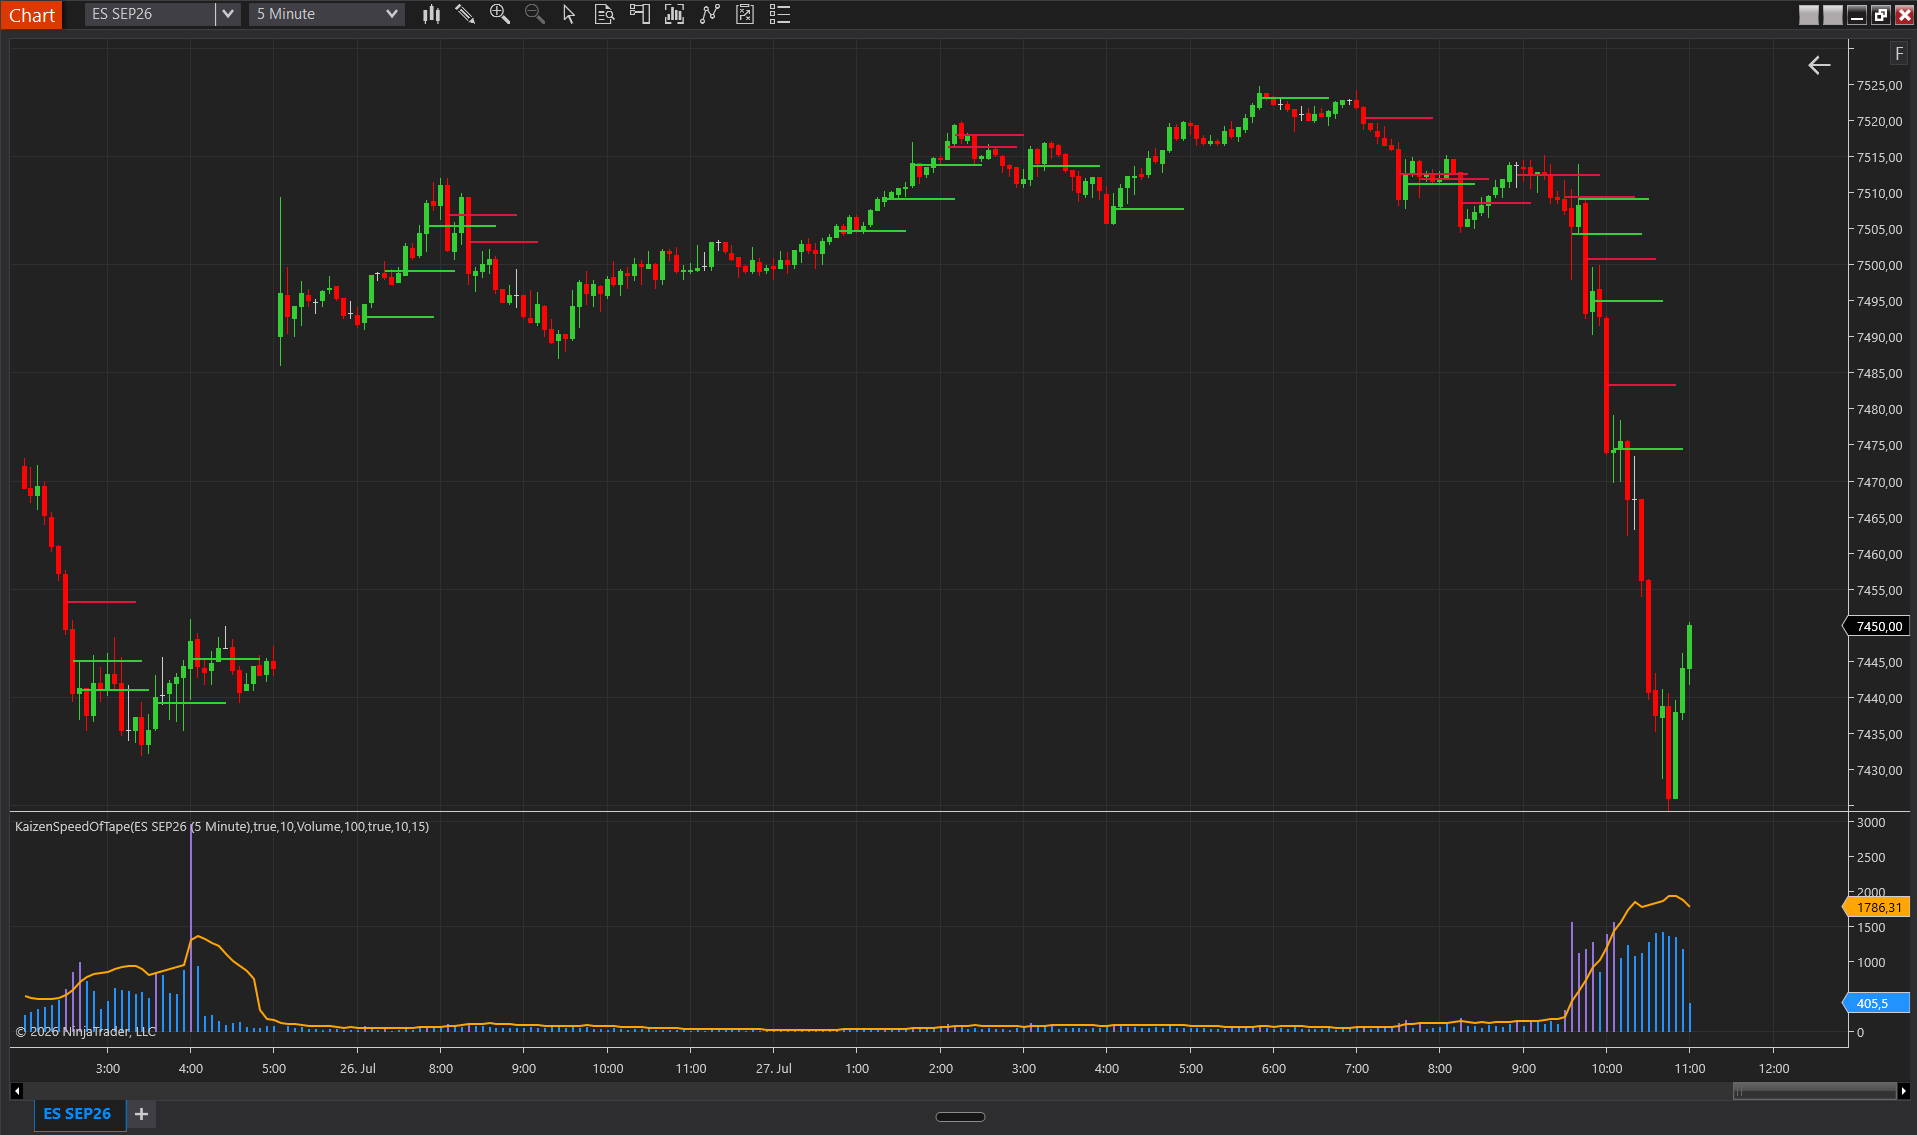
KaizenSpeedOfTape measures the speed of the tape: it sums a chosen metric (volume, tick count, buys, sells or delta) over a configurable time window (1–300 seconds) and plots the result as a histogram. An optional SMA filter smooths the baseline; when the histogram exceeds the filter, the bar is highlighted and a horizontal signal line is drawn on the price chart at the bar’s midpoint (green for bullish, red for bearish based on the buy vs. sell volume of that bar).
Interpretation
- Tall bars above the filter line = sudden tape acceleration. Short tall spikes can mark flash reversals; sustained tall bars confirm breakout momentum.
- Volume mode = contract flow. Ticks mode = trade frequency (distinguishes retail fragmentation from institutional block orders). Delta mode = directional speed.
- Auto filter (SMA) adapts to the market regime; the manual threshold is static, preferred for backtest precision.
- Signal lines persist backward into history, marking where the tape fired; useful for post-trade review.
Settings
Settings
- Calculation Type — Volume / Ticks / Buys / Sells / Delta. Default Volume.
- Time Window (seconds) — lookback for the speed sum. Default 15. Shorter = more reactive, longer = smoother. If your bars are longer than the window, it always covers a fraction of the bar.
Filter
- Auto Filter — On = adaptive SMA baseline; off = fixed manual threshold.
- Auto Filter Period — SMA period. Default 10.
- Manual Threshold — static threshold, used when Auto Filter is off. Default 100. The unit depends on Calculation Type (contracts for Volume, trade count for Ticks, etc.).
Signal Lines
- Show Signal Lines — draws a horizontal line on the price panel when a spike fires. Bullish (buy vol ≥ sell vol) = green; bearish = red.
- Signal Line Length (bars) — how far the line extends backward. Default 10.
Colors
- Histogram / Filter Line / Highlight / Bullish Signal / Bearish Signal — colors of each element.
Requirements
For accurate history, Tick Replay must be enabled (see Installation and getting started).
Don't own it yet?
Lifetime license, no subscription.