KaizenStatsProfile
KaizenStatsProfile projects the 12 classic prior-day and overnight levels onto the chart with the historical probability that each one is touched during today's RTH session.
Updated: August 1, 2026
Projects onto the chart the 12 classic day-trading levels from the previous day (and from the overnight session) together with the statistical probability that each level is touched during today’s RTH. The probabilities come from 11 years of history (2015–2025) of the major index futures, processed with QuantConnect. And, crucially, they are conditioned on the day’s opening type according to the Auction Market Theory (Dalton) classification.
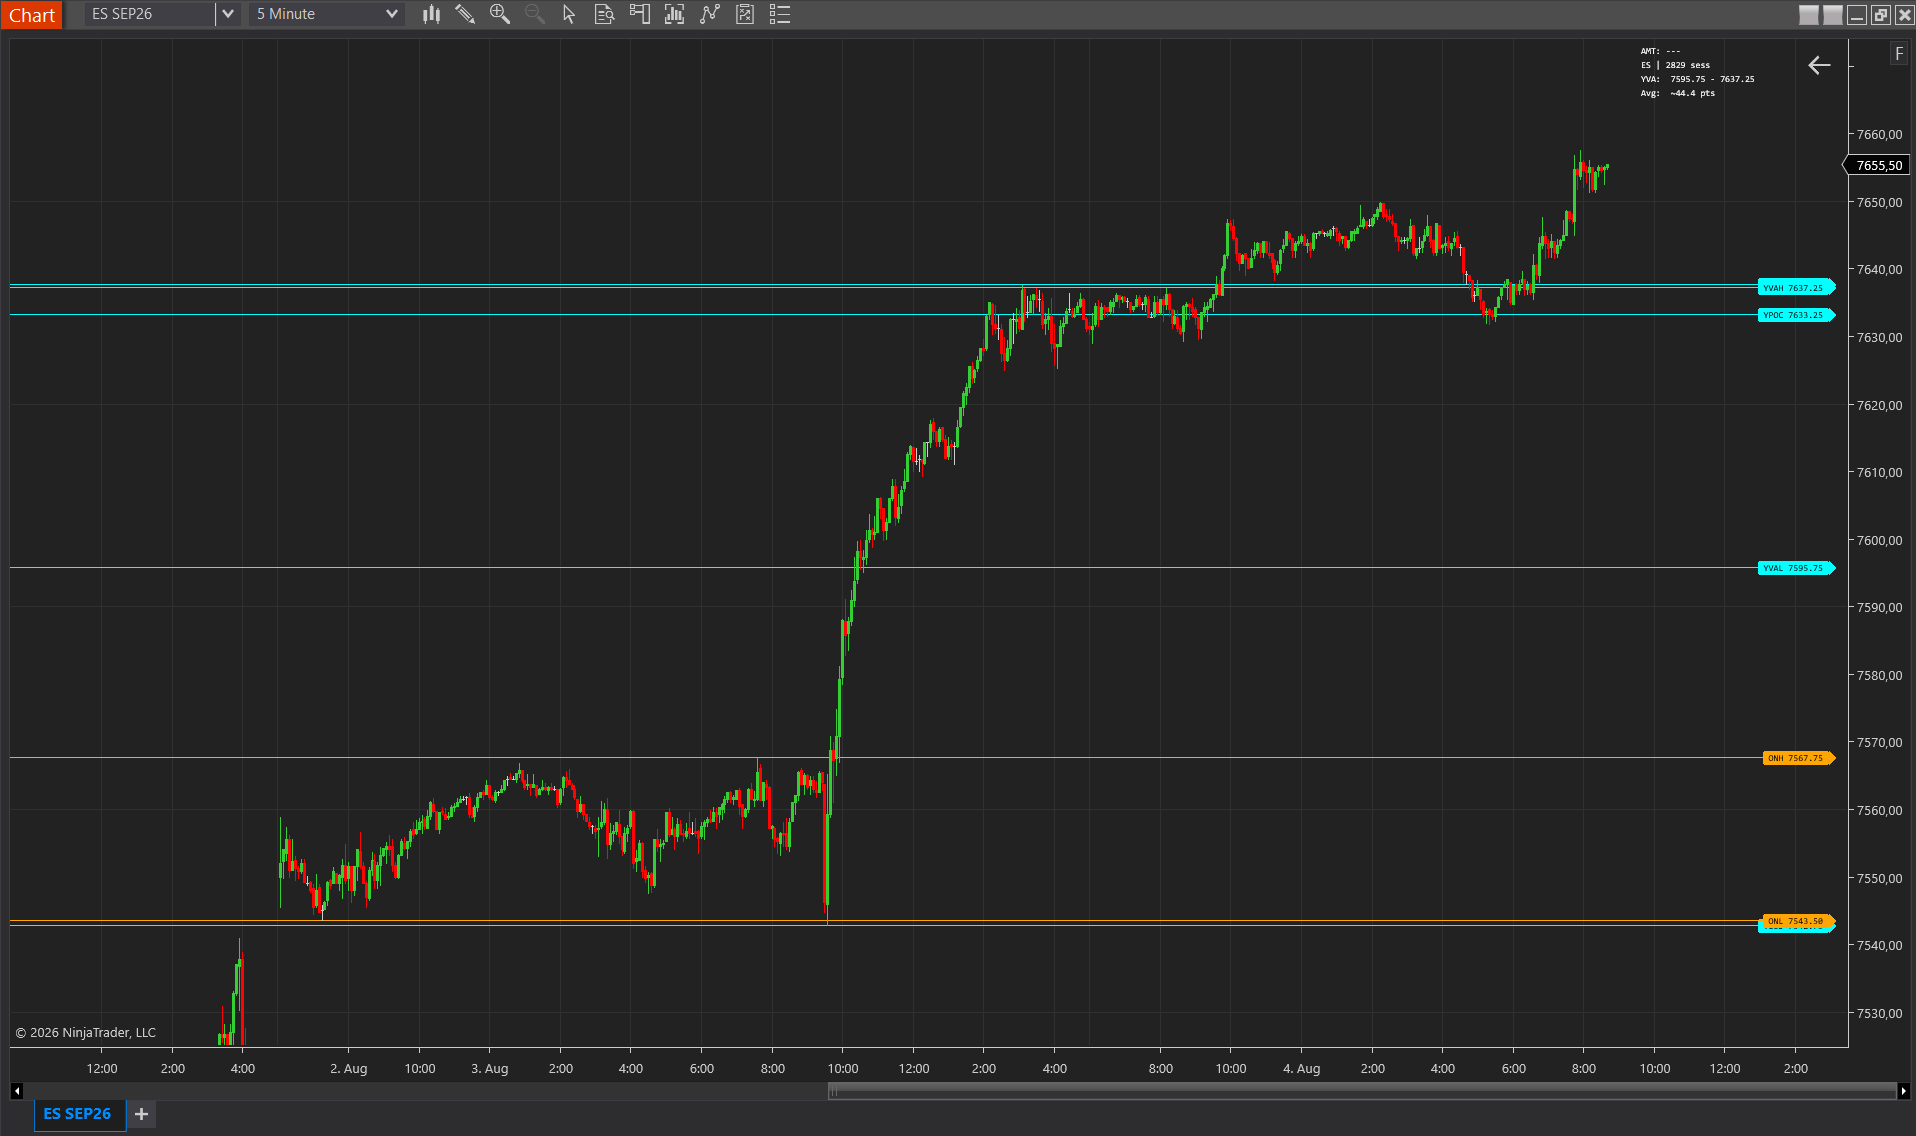
Unlike traditional indicators that only draw the levels, KaizenStatsProfile tells you how likely it is that price touches each one today, and that probability changes dramatically depending on how the market opened relative to yesterday’s range and value area. Since v2.2 it also no longer stays constant all day: once a level has been tested, the remaining ones are re-weighted live (see Dynamic probabilities).
Statistical database recomputed (v2.2). All four instruments were recomputed with exact US-session alignment (09:30–16:00 ET). That is why the percentages differ from v2.0.x, and it is expected and correct: they now precisely reflect the session actually being traded. Most visible consequence: the most frequent AMT class is now OIV (open inside the value area), exactly as auction theory expects. So do not compare percentages one-to-one against notes taken with an older version.
Coverage by instrument
- ES (S&P 500) — full ES version, Micro MES version. History 2015 → 2025.
- NQ (Nasdaq 100) — full NQ version, Micro MNQ version. History 2015 → 2025.
- YM (Dow Jones) — full YM version, Micro MYM version. History 2015 → 2025.
- RTY (Russell 2000) — full RTY version, Micro M2K version. History 2017 → 2025 (RTY E-mini launched July 2017).
Instrument detection is automatic: if the chart shows MNQ, the indicator loads the NQ statistics (the Micro and the full-size contract share the same level structure). YM and other instruments that will be added over time appear automatically without needing to update the bundle.
The 12 levels
- YHOD / YLOD — High and Low of yesterday’s RTH.
- YPOC / YVAH / YVAL — POC and 70% Value Area boundaries of yesterday.
- YIBH / YIBL — High and Low of yesterday’s Initial Balance (first hour 09:30–10:30 ET).
- ONH / ONL — High and Low of the overnight range (18:00 ET prior → 09:29 ET today).
- YGAP — Yesterday’s close (gap-fill reference).
- Half-Gap — Midpoint of the gap between yesterday’s close and today’s open.
- YMID — Midpoint of the previous day’s range ((YHOD + YLOD) / 2).
The 5 AMT classes (classification at the open)
The indicator classifies each session right as the market opens, based on where today’s open sits relative to yesterday’s range and value area:
- OAR (Open Above Range) —
Open > YHOD. - OAV (Open Above Value) —
YVAH < Open ≤ YHOD. - OIV (Open In Value) —
YVAL ≤ Open ≤ YVAH(“neutral” case). - OBV (Open Below Value) —
YLOD ≤ Open < YVAL. - OBR (Open Below Range) —
Open < YLOD.
Corrected in v2.3: the RTH open was taken up to a full bar too early. NinjaTrader stamps bars with their closing time, so the bar stamped 09:30 still contains premarket, and its open was used as the session open. On 15- or 30-minute charts that is enough to flip the class. Some opening types, and the probabilities conditioned on them, therefore differ from v2.2; the new values are the correct ones. The same source now also feeds KaizenTPO and KaizenVolumeProfile, so all three displays agree.
Interpretation
The probabilities are read as context, not as binary signals. If the indicator shows YPOC 68% on an OIV day, it means that historically, when a session opened in OIV class, price touched the YPOC during RTH in 68% of cases. It is distributional information, not a prediction.
The same level changes 5× depending on the opening class. YPOC typically has ~15% touch on OAR days (open well above the range → low probability of returning to yesterday’s POC) but ~70-77% on OIV days (open within value → strong POC gravity). That contrast is the information no classic indicator gives you.
Day types with very different probabilities:
- OAR / OBR — trend/expansion days. The previous day’s levels lose gravity: the market is outside the prior range and tends to continue.
- OAV / OBV — “soft trend” days. The market opened outside Value but inside the Range. Mean-reversion to the value area is likely but not guaranteed.
- OIV — classic balance/mean-reversion day. POC and value bounds have a high probability of acting as magnets and bounces.
Fixed vs dynamic levels
The 12 levels from the previous day are fixed throughout the whole session. What does change dynamically is:
- The probabilities themselves, once the first test has occurred (see the next section).
- The top-right box shows the POC/VAH/VAL of the CURRENT day, recalculated tick by tick.
- The
*(asterisk) marker next to the label appears automatically when price touches that level during RTH, to see at a glance which levels are already validated and which are still pending. - Today’s Initial Balance (IBH/IBL) forms during the first hour of RTH and becomes fixed at 10:30 ET.
Dynamic probabilities (new in v2.2)
The AMT class answers the question “how did the day start?”. But it says nothing about what has happened since. That is exactly what this feature adds: once a level has been tested during the session, the probabilities of the still-open levels are re-weighted, using conditional statistics from the same 11-year dataset.
The idea behind it is one of the most stable observations in auction theory: on most days only one extreme gets tested. If the market has already probed yesterday’s VAH, the probability that it also reaches the VAL on the same day drops considerably: the day has chosen its direction.
The label shows both values:
63>35% YVAL 7551.25
Read as: the base probability of a YVAL test was 63% this morning; after another level (here YVAH) has since been tested, the realistic probability is only 35%. If nothing has been tested yet, or too few historical cases exist for that combination, the label shows the plain percentage unchanged.
How the value is determined
- The indicator remembers the order in which levels were touched today.
- For each still-open level it looks for the most recently tested level that has a sufficiently sampled conditional statistic under today’s AMT class: the most recent test carries the freshest information about the day’s character.
- “Sufficiently sampled” means at least 30 historical cases for that combination of AMT class, conditioning level and target level. Below that, no re-weighting is applied on purpose: a conditional probability built on 6 observations would be false precision.
- Levels that have already been tested keep their base value: they are done, not to be re-assessed.
Practical use: the feature answers “what is still in reach today?” faster than reading the static percentages could. If a level drops from 60% to below 30% after the first test, it is barely viable as a target anymore, and a stop behind it is correspondingly safer. If a value rises, the test that occurred paved the way for continuation.
Can be switched off via Dynamic Probabilities (group 3. Display): the indicator then shows the static values permanently.
Line style by probability
So the chart does not become visually saturated, each line’s thickness/style reflects the probability:
- Solid — probability > 40% (relevant level).
- Dashed — 10–40% (level to watch).
- Dotted — less than 10% (unlikely today, marked for reference).
Context box (top-right corner)
Next to the levels, a box shows at a glance:
- Today’s current AMT class.
- Today’s RTH open.
- Yesterday’s Value Area (YVAH / YVAL).
- Historical average range (expected today).
Settings
1. Levels to show
Individual toggles to enable/disable each of the 12 levels as preferred. For example if you are only interested in the “yesterday’s Volume Profile” block, you turn off YIBH/YIBL/ONH/ONL/YGAP and leave YHOD/YLOD/YPOC/YVAH/YVAL/YMID.
2. Visuals
- Show Pills — Shows the probability “pills” with the format XX% LEVEL PRICE (e.g. 77% YPOC 7587.00).
- Show Lines — Draws the horizontal lines at each level on the chart.
- Dynamic Probabilities — (new in v2.2) Re-weights a level’s probability once another level has been tested today. The label then shows base>adjusted% (e.g. 62>30% ONH). Default on; turn off for the plain static value.
- Show Touch Marker — Enables the automatic
*asterisk when price touches a level during RTH. - Show Today Box — Shows the top-right box with AMT class + open + value area + expected range.
- Style Solid Threshold — Minimum probability for a solid line (default 40%).
- Style Dashed Threshold — Minimum probability for a dashed line (default 10%). Below this threshold → dotted.
- Label Position — Side on which the pills are rendered (left / right).
3. Colors
Each of the 12 levels has its own configurable color. By default, colors grouped by category are used:
- Prior range (YHOD, YLOD) — Red / Green.
- Prior Value Profile (YPOC, YVAH, YVAL) — Gold / Cyan / Magenta.
- Initial Balance (YIBH, YIBL) — Orange.
- Overnight (ONH, ONL) — Light gray.
- Gap (YGAP, Half-Gap) — White.
- Midpoint (YMID) — Medium gray.
Use cases
- Target management — If your setup aims at YPOC and the indicator shows that historically on OIV days the YPOC is touched with 68% probability, it is a reasonable target. If today’s class is OAR and the probability drops to 15%, consider an intermediate target instead.
- Day-type confirmation — If the AMT class is OIV (classic mean-reversion) and your trading system is optimized for trending days, you can skip that day or reduce size.
- Stop validation — If your natural stop is above the YHOD but the indicator shows that in OBR class (bearish day) the YHOD is touched with only 6% probability, your stop is protected with high statistical confidence.
- Bot filter — Kaizen bots can already read the AMT class and the probabilities via the API, letting them filter setups by day type.
Honest limitations
- Data through 2025 — The statistics reflect 2015–2025 market behavior (RTY since 2017). Future structural changes (0DTE options volume, changes in dealer flow, etc.) may alter the probabilities. We recalculate them periodically.
- The probabilities are historical frequencies, not guarantees — A 77% touch probability means that in 23% of past cases it was NOT touched. Use them as distributional context, not as certainty.
- Atypical events (FOMC, large NFP, options expiration, earnings week) have different distributions that are not separated out in this version. Future versions may add that segmentation.
- The dynamic probabilities are pairwise, not fully conditional — Re-weighting happens against the most recently tested level with a sufficient sample, not against the complete sequence of everything tested today. A model over all combinations would no longer be statistically supportable: the case count per combination falls below the 30-sample threshold very quickly. The adjustment shown is therefore the best-supported one, not the theoretically finest.
- Not every level has a conditional statistic — For rare combinations (typically extreme classes such as OAR/OBR paired with rarely tested levels) the static value stays. That is deliberate: the indicator would rather show the defensible number than a pretty one built on too few cases.