KaizenBigTrades
KaizenBigTrades groups consecutive same-side ticks into sweeps and marks large aggressive orders on the chart with size-proportional markers, filters and optional alerts.
Updated: August 1, 2026
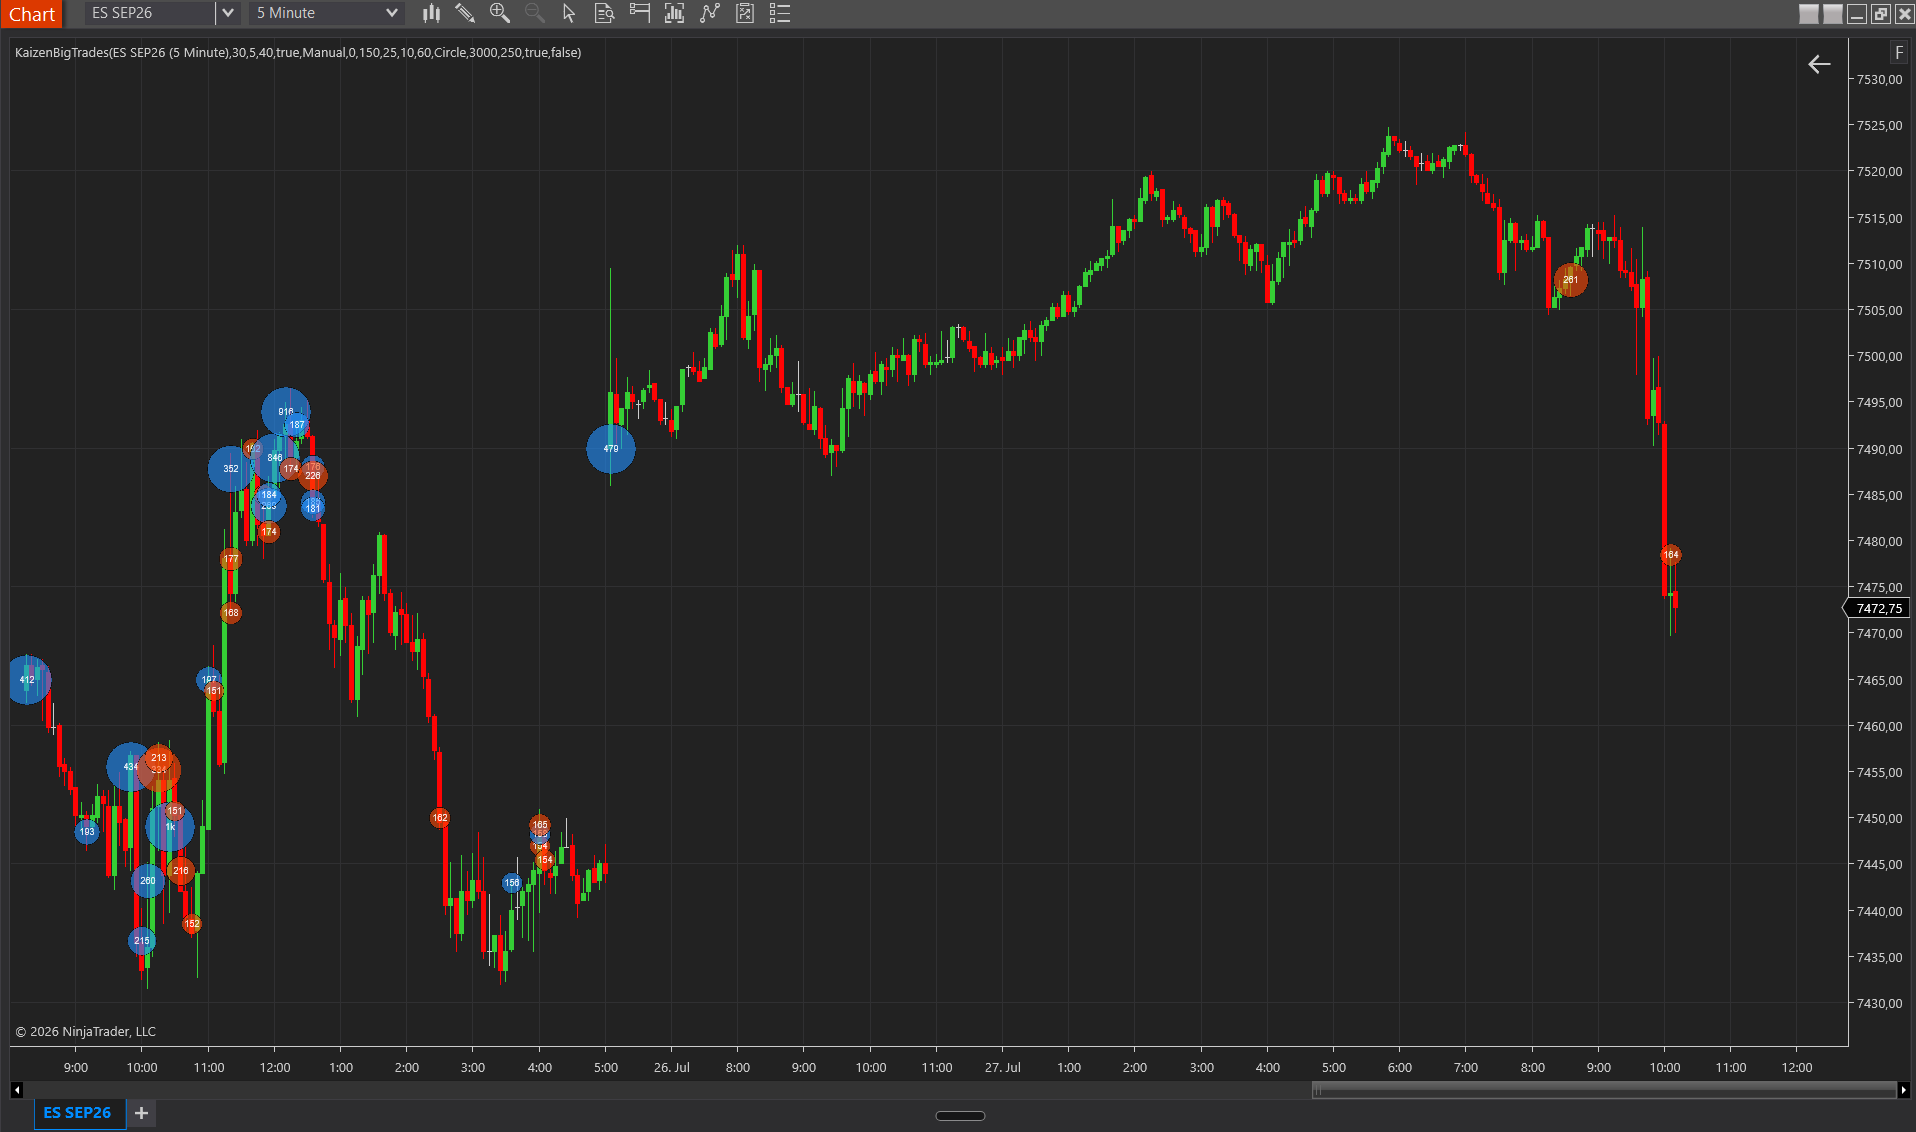
KaizenBigTrades identifies large aggressive market orders by grouping consecutive same-side ticks within a short time window into one sweep, then renders each qualifying aggregate as a colored marker whose size is proportional to the volume. It works like a visual sweep detector: when an institution sends a large market order that sweeps several levels of resting orders, it prints as a burst of same-side ticks across several price levels, and this indicator stitches that burst back into a single event.
Interpretation
- Marker position = the price level where the aggregated fill occurred.
- Marker color = Buy (aggression against the ask), Sell (aggression against the bid) or Between (trade in the middle, rare).
- Marker size = scales with the aggregated volume (linear or logarithmic).
- Clusters of blue markers (buys) in an upward move = demand appearing aggressively; look for continuation or, if price stalls, absorption.
- Large isolated markers near swing highs/lows often mark exhaustion or stop runs.
- A total absence of markers in a directional move indicates a slow grind without stops, a different character than a sweep-driven move.
Aggregation concept
A single institutional order fills against many resting orders and prints as dozens of small ticks within a few milliseconds. Without aggregation, each fill would look like a retail trade.
Changed in v2.3. Up to v2.2 the window only grouped ticks at the same price. But a large aggressive order sweeps several price levels, so the sweep broke into one aggregate per level, each individually below your minimum volume and therefore often not drawn at all. Consecutive fills now belong to the same aggregate when they share the same side, fall inside the window, and move monotonically in the direction of the aggression (buys to rising prices, sells to falling ones). The bubble appears at the price where the sweep ended — where it left the market. Only the final aggregated volume is compared against your filter thresholds. Measured against another platform across two ES sessions, trades above 150 contracts were recovered 23% of the time before, 93% now.
Settings
Aggregation
- Aggregation Window (ms) — maximum gap between two fills of the same aggressive order. Default and recommendation 5 ms; range 1–200. Larger values merge separate orders into one bubble. Careful when upgrading: before v2.3 this bounded the gap between ticks at the same price, and 30 was normal — under the new sweep rule a carried-over 30 overstates volume by roughly 13%. Reset it to 5.
Filter
- Filter Mode — Auto: the indicator dynamically learns a volume threshold from recent session history so that roughly N markers appear per day (see Auto-Filter Target Signals/Day). Manual: only Min/Max Volume are used as hard cutoffs.
- Auto-Filter Lookback Days — number of previous sessions sampled for the volume distribution that feeds the automatic threshold. Default 5. Higher = more stable threshold but slow reaction to volatility-regime changes; lower = more reactive but noisier.
- Auto-Filter Target Signals/Day — the automatic threshold adjusts so that on average this many markers appear per trading day. Default 40. Raise it if the chart feels too quiet; lower it if you only want the biggest prints. Applies in Auto mode only.
- Manual Min Volume — applies in BOTH modes as a hard floor. In Manual mode it is the primary filter. In Auto mode it acts as a noise floor: aggregates below this volume are discarded before the automatic calibration sees them, which prevents retail-sized fills from skewing the learned threshold. Default 100. 0 to disable the floor.
- Manual Max Volume (0=off) — optional upper cap; hides aggregates above this size. Useful for filtering internal exchange or clearing prints that distort the scale. Default 0 (off).
Visuals
- Marker Shape — Circle / Rectangle / Triangle / Diamond.
- Marker Min Radius (px) — minimum marker size (for the smallest qualifying aggregate). Default 10 px.
- Marker Max Radius (px) — maximum marker size (for the largest aggregate in the displayed window). Default 25 px.
- Use Log Scale — scales the marker by log(volume) instead of linear volume. Useful when you have a mix of medium and huge trades: linear scaling would make every medium trade look tiny next to a monster.
- Marker Opacity % — default 60; keeps the markers visible without covering the candles behind them.
- Show Volume Label — prints the aggregated volume as a number inside the marker.
- Max Trades Per Bar — safety limit of markers per bar; if exceeded, only the largest are kept. Default 250.
Colors
- Buy Color — aggressive buy (price ≥ ask at the fill). Default DodgerBlue.
- Sell Color — aggressive sell (price ≤ bid at the fill). Default OrangeRed.
- Between Color — trade printed between bid and ask, rare, typically in a dark pool or mid-auction. Default Gray.
Performance
- Disable Progressive Auto in Historical — if active, the automatic threshold is computed once from the full historical sample instead of recalibrating bar by bar progressively. Faster historical load; live sessions always use progressive calibration.
- Max Stored Bars — limit of aggregated-data bars in memory. Default 3000.
Requirements
For accurate history, Tick Replay must be enabled (see Installation and getting started).