KaizenStatGrid
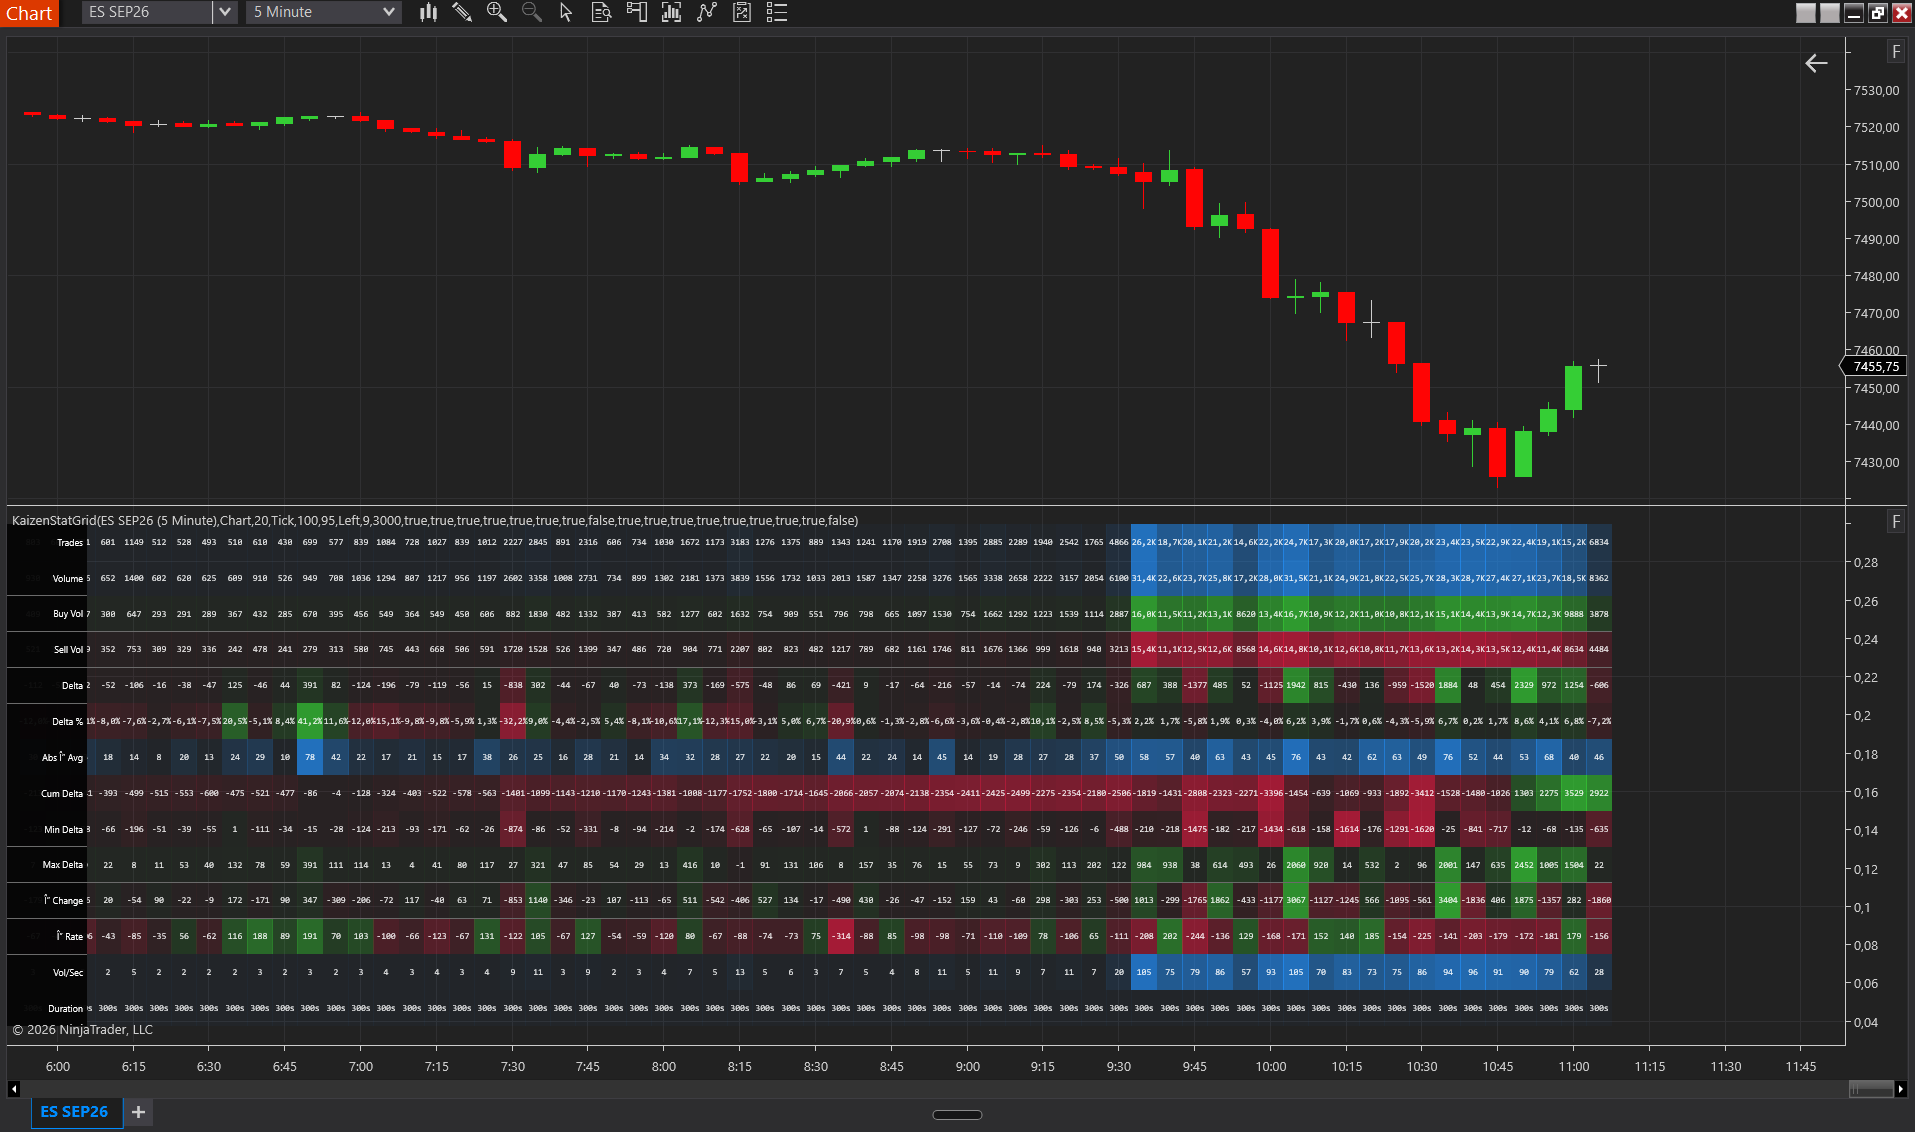
KaizenStatGrid shows a color-coded grid of per-bar order flow statistics: bid/ask volume, trade count, delta, delta rate, bar duration and volume per second, tick by tick.
Updated: July 1, 2026
KaizenStatGrid is a tick-by-tick statistics grid for each bar. It collects bid/ask volume, trade count, signed delta, delta %, cumulative delta, delta rate, bar duration and volume per second, and renders them as a colored heatmap (rows = stats, columns = bars). Each cell’s intensity scales with the magnitude: signed stats use positive/negative colors and unsigned stats use a single neutral color.
Interpretation
- A green row = positive delta or buying pressure; a red row = negative delta or selling pressure. Intensity reflects the magnitude.
- Volume/Sec at a peak with a short Duration = a climactic bar. Slow Volume/Sec with a long Duration = consolidation.
- Cumulative Delta resets at the session open. A rising CumDelta line while price falls = bullish divergence.
- Min / Max Delta shows the intra-bar swings: a bar with Max Delta = +500 but a final Delta = -100 means the buying peaked and then reversed.
- Delta Rate = the maximum delta accumulation over a short rolling window (N ticks or N ms). Detects the speed of directional flow; an explosive reading often marks climactic moves.
Settings
Statistics
Each statistic is an independent on/off toggle.
- Show Trades — count of individual trades (ticks) per bar. Reveals fast vs. slow bars.
- Show Volume — total volume (buy + sell) per bar. Default on.
- Show Buy / Sell Volume — separate rows for buy and sell volume. Default off (adds clutter).
- Show Delta — net delta (buy − sell) per bar. The core order-flow metric. Default on.
- Show Delta % — delta as a percentage of total volume. Normalizes across bars of different size (+500 in 10k = 5%, +500 in 1k = 50%).
- Show Abs Delta Avg — average absolute delta per traded level within the bar; reveals concentration of conviction.
- Show Delta Cumulative — running sum from the session start.
- Show Min / Max Delta — intra-bar delta extremes.
- Show Delta Change — current-bar delta minus previous-bar delta; detects momentum changes.
- Show Delta Rate — maximum delta over the rolling window configured below. Default on.
- Show Volume/Sec — volume divided by bar duration. Climax detector.
- Show Duration — length of the bar in seconds (from the first to the last tick timestamp).
Delta Rate
- Delta Rate Type — Tick = rate over N individual trades. Millisecond = rate over N ms. The tick-based one is the most consistent across instruments.
- Delta Rate Value — lookback window. Default 100 (ticks or ms). Smaller = jittery, larger = smoother.
Appearance
- Cell Height (px) — preferred row height. Default 20. The engine auto-scales if too many stats are enabled.
- Legend Position — Left or Right of the grid.
- Show Legend — toggle for the panel of stat-name labels.
- Cell Color Scale — Chart = scales only to the visible bars (makes recent movement stand out). All = scales to the entire history (true relative magnitudes).
- Values ×1000 — shows volumes divided by 1000, for crypto or index instruments with huge volumes.
- Max Font Size — cap on the font size for the cell text.
- Max Stored Bars — history limit. Default 3000.
Colors
- Positive / Negative / Neutral / Text / Grid Line / Legend Background Color — colors and opacity of each grid element.
Requirements
For accurate history, Tick Replay must be enabled (see Installation and getting started).
Don't own it yet?
Lifetime license, no subscription.