KaizenFootprint
KaizenFootprint overlays bid and ask volume at every price in each bar, with delta and total-volume modes, diagonal imbalances, stacked zones and Big Delta cells.
Updated: August 1, 2026
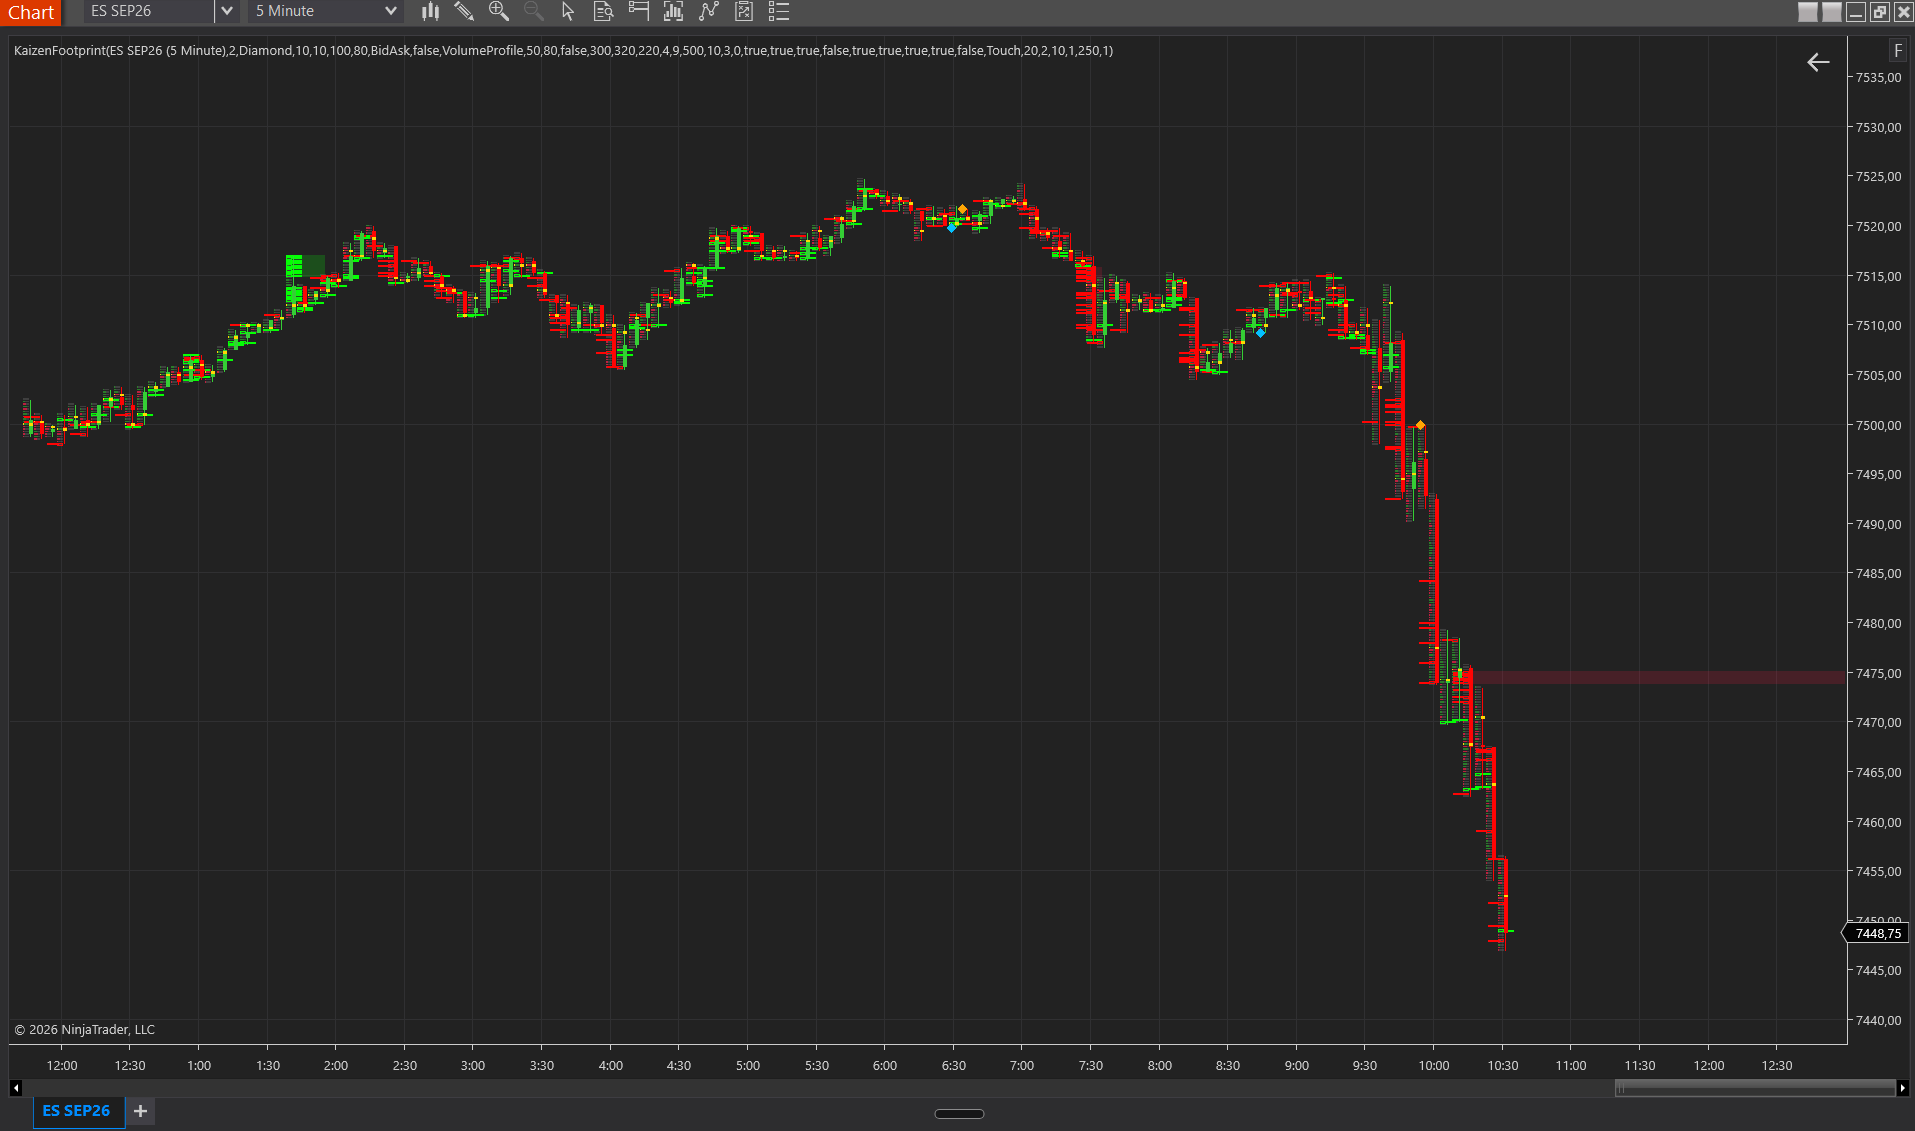
KaizenFootprint overlays a detailed order flow breakdown on each price bar. Each price level within the bar shows two numbers: the bid-side volume (sellers, aggressive hits) on the left and the ask-side volume (buyers, aggressive lifts) on the right. From those numbers the engine detects diagonal imbalances, stacked zones, absorption, unfinished business and the bar’s POC, all visually highlighted.
Interpretation
- Wide numbers on the right (ask-heavy) = buyers dominated that level aggressively. Wide numbers on the left (bid-heavy) = sellers dominated.
- Imbalance cell (highlighted) = one side is ≥ 3× the diagonally adjacent opposite side. A bullish imbalance stacks above a strong ask column; a bearish one stacks below a strong bid column.
- Stacked imbalance zone = 3 or more consecutive imbalances in the same direction. These zones project to the right as support and resistance, high-conviction levels because they reflect sustained one-sided aggression.
- Absorption = the volume of one side is large but price did not move in that direction. Strong buying absorbed at the bar’s high = sellers were there to contain the buying. Often marks exhaustion.
- Unfinished business = the bar’s high has ask volume > 0 (buyers still active at close) or the low has bid volume > 0 (sellers still active). They are magnets; the market tends to come back to complete the auction.
- Bar POC (highlighted level) = the price with the most total volume within that individual bar.
Magnifier — Ctrl+M
Hover over a footprint bar and press Ctrl+M to toggle the magnified zoom view. The zoom factor and the window’s width and height are configurable (see the Magnifier group below). The shortcut is hard-coded; there is no user setting to remap it.
Histogram Modes
In addition to the classic “numbers in cells” visualization, you can render a histogram behind the text that visualizes a per-level metric as a horizontal bar:
- None — no histogram; classic cell coloring.
- VolumeProfile — the bar length represents the total volume at the level; proportional bid/ask split color.
- DeltaProfile — the bar represents the signed delta centered in the cell: positive extends to the right (ask color) and negative to the left (bid color).
- TradesProfile — the bar length represents the trade count per level; proportional bid/ask split color.
With a histogram mode active, cell backgrounds switch to neutral dark and imbalances are drawn as colored borders (not fills) to keep the histogram legible.
Delta and volume side by side (new in v2.3)
With Display Mode = DeltaAndVolume, every price level gets two half-width columns: signed delta on the left, total volume on the right, each with its own number and histogram bar. One cell then carries both facts: how much traded there and who was aggressive.
Each column scales to its own maximum. On a shared scale, volume would flatten the delta column, because delta is the difference between two numbers whose sum is the volume. Set the volume column’s color under Colors → Volume Column (default Teal); the delta column keeps the existing buy/sell coloring. The magnifier (Ctrl+M) follows the mode.
Big Delta cells (new in v2.2)
Imbalances work on a ratio (one side ≥ 3× the diagonal opposite), which makes a cell of 9 against 3 contracts an imbalance even though almost nothing happened in absolute terms. The Big Delta filter adds the second perspective, absolute size: any cell whose absolute delta (ask − bid) reaches the Big Delta Threshold is painted in a distinct color, buy-side in cyan and sell-side in magenta (both configurable under Colors).
What it’s for: the genuinely large one-sided prints pop out without you having to read the numbers. In fast moves you see instantly at which level the aggressive flow actually printed size, and where it was just noise. The highlight also applies inside histogram mode and in the magnifier (Ctrl+M).
Tuning: the threshold depends on instrument and timeframe. Starting points: ES 5-minute 100–300, NQ 5-minute 50–150, 1-minute charts roughly a fifth of that. Rule of thumb: set it so at most one to three cells light up per bar; if everything lights up, the value is too low and the filter loses its signal value.
Big Delta coloring overrides the normal cell coloring (buy/sell dominant). Imbalance borders and POC highlighting are unaffected and remain visible.
Settings
Data
- Ticks Per Level — row aggregation. 1 = one row per tick (maximum detail). 4 on ES = one row per whole point. Higher = easier to read on dense bars, but you lose micro-imbalances.
- Min Trade Size — ignores individual ticks with volume below this value. 0 = no filter. Raise it if you want to ignore small retail fills.
- Volume Divisor — divides all displayed volumes by this factor (for example 1000 to show in thousands). Useful for instruments with very large volumes.
Display
- Display Mode — BidAsk shows “sell × buy” per level. Delta shows the signed delta. TotalVolume shows the combined volume. DeltaAndVolume (new in v2.3) shows two columns per price level: delta on the left, volume on the right, each with its own number and histogram.
- Histogram Mode — None / VolumeProfile / DeltaProfile / TradesProfile (see the list above).
- Histogram Width % — maximum histogram-bar width as a % of cell width. Default 80.
- Histogram Opacity % — default 50. Lower = subtle background bars; higher = prominent.
- Show Bar Summary — shows the total volume and net delta as a summary below each bar.
- Show POC — highlights each bar’s Point of Control.
- Show Candle Body — draws a thin candle-body strip on the right edge of each footprint column for quick directional orientation.
- Max Font Size — maximum font size for the cell text. Text auto-scales with zoom.
- Cell Opacity % — transparency of the cell background fill.
- Highlight Big Delta Cells — (new in v2.2) marks cells whose absolute delta (ask − bid) reaches the threshold in a distinct color. Overrides normal cell coloring. Default off.
- Big Delta Threshold — (new in v2.2) minimum absolute cell delta (contracts) that triggers the highlight. Default 100. Tune per instrument (see the “Big Delta cells” section above).
Imbalances
- Show Imbalances — enables diagonal imbalance detection.
- Imbalance Ratio % — default 300 = the dominant side must be ≥ 3× the other. Lower (200%) = more imbalances, more noise; higher (500%) = only the most extreme.
- Min Imbalance Delta — minimum absolute delta on the dominant side before flagging. Default 10. Filters micro-imbalances on tiny volume.
- Ignore Zero Side — when active, does not flag an imbalance if the losing side has zero volume (prevents marking natural gaps).
- Show Tick Marks — draws small marks on the edges of imbalance cells for quick visual identification.
- Tick Mark Width / Thickness — width in px and stroke thickness of those marks.
Stacked Imbalances
- Show Stacked Zones — projects zones where 3 or more consecutive imbalances stack vertically.
- Min Stack Size — minimum consecutive imbalances to form a zone. Default 3.
- Zone Opacity % — fill transparency of the stacked zones.
- Zone End Condition — Touch = the zone closes when a wick enters it. Close = the zone only closes when a bar closes inside. Touch is more aggressive, Close more conservative.
Auction Status
- Show Unfinished Business — dashed lines from bars whose high has ask > 0 or whose low has bid > 0, unfinished auctions that tend to pull price back.
- Show Finished Business — markers on bars with clean auctions (ask = 0 at the high, bid = 0 at the low).
Colors
- Buy Dominant / Sell Dominant / Neutral — base cell coloring by dominant side.
- Bullish Imbalance / Bearish Imbalance — cells flagged as imbalance.
- POC — the bar’s POC level.
- Text — cell text.
- Stacked Bullish Zone / Stacked Bearish Zone — stacked-imbalance zones.
- Unfinished Business / Finished Business — auction-status markers.
- Candle Bullish / Candle Bearish — candle-body strip.
- Big Delta Buy — (new in v2.2) default Cyan.
- Big Delta Sell — (new in v2.2) default Magenta.
- Volume Column — (new in v2.3) default Teal. Histogram bar of the volume column in DeltaAndVolume mode.
Absorption
- Show Absorption — enables detection of absorption markers.
- Absorption Depth (Ticks) — how many ticks from the bar’s extreme to scan. Default 2, scans the 2 top and bottom price levels.
- Absorption Min Volume — minimum aggressive-side volume at the extreme before flagging. Default 10.
- Absorption Marker Shape — Circle / Rectangle / Triangle / Diamond.
- Absorption Marker Size — marker size in px. Default 10.
- Bullish Absorption Color — color when the buying side is absorbed at a low. Default DeepSkyBlue.
- Bearish Absorption Color — color when the selling side is absorbed at a high. Default Orange.
Performance
- Max Stored Bars — footprint data bars kept in memory. Default 500. Raise it for more history, lower it to save memory.
- Update Interval (ms) — throttle for live-bar recalculations. Default 250 ms.
Magnifier
- Zoom Factor — scale factor for cell height when the magnifier is active. Default 4.0.
- Width (px) — width of the magnifier popup window. Default 220.
- Height (px) — height of the popup. Default 320.
Requirements
KaizenFootprint requires Tick Replay enabled in NinjaTrader for accurate historical data; on a live connection the real tick data is used directly (see Installation and getting started).